The Size of the State
The UK civil service shrank by 50% between 1976 and 2016, then grew by 36% in the decade that followed. The public sector now employs more people than at almost any point since privatisation began — and the NHS accounts for the majority of that growth. Meanwhile, productivity has fallen and outcomes on most international measures remain below the OECD average. Six graphics on who works for the state, what they cost, and what the taxpayer gets in return.
What Outcomes Tell Us
UK health outcomes compared to peer countries. On five measures — healthy life expectancy, avoidable mortality, cancer survival, A&E wait-to-mortality link, and Commonwealth Fund overall ranking — the UK performs below the OECD average on most metrics despite spending at or above average as a share of GDP. More spending has not produced commensurately better outcomes.
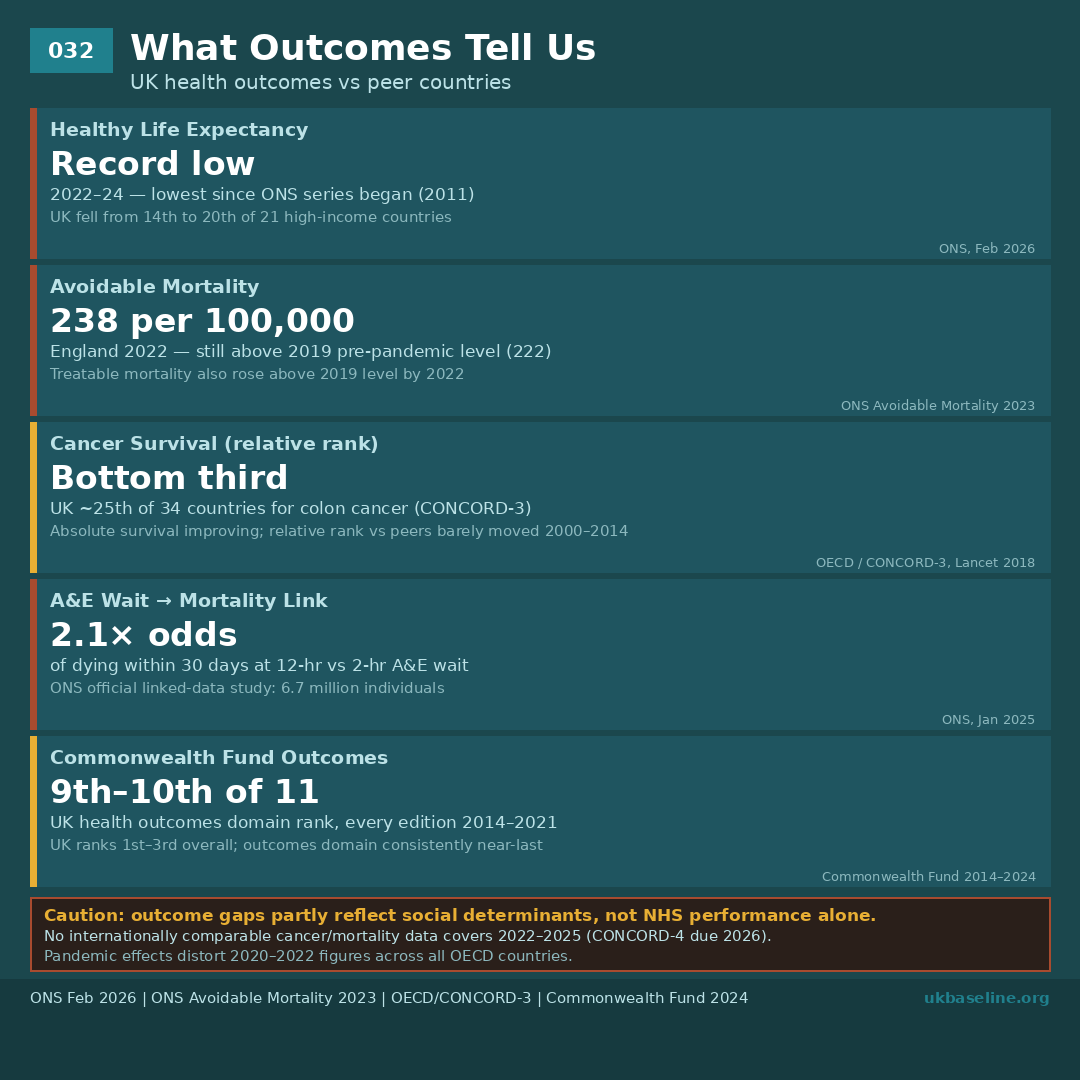
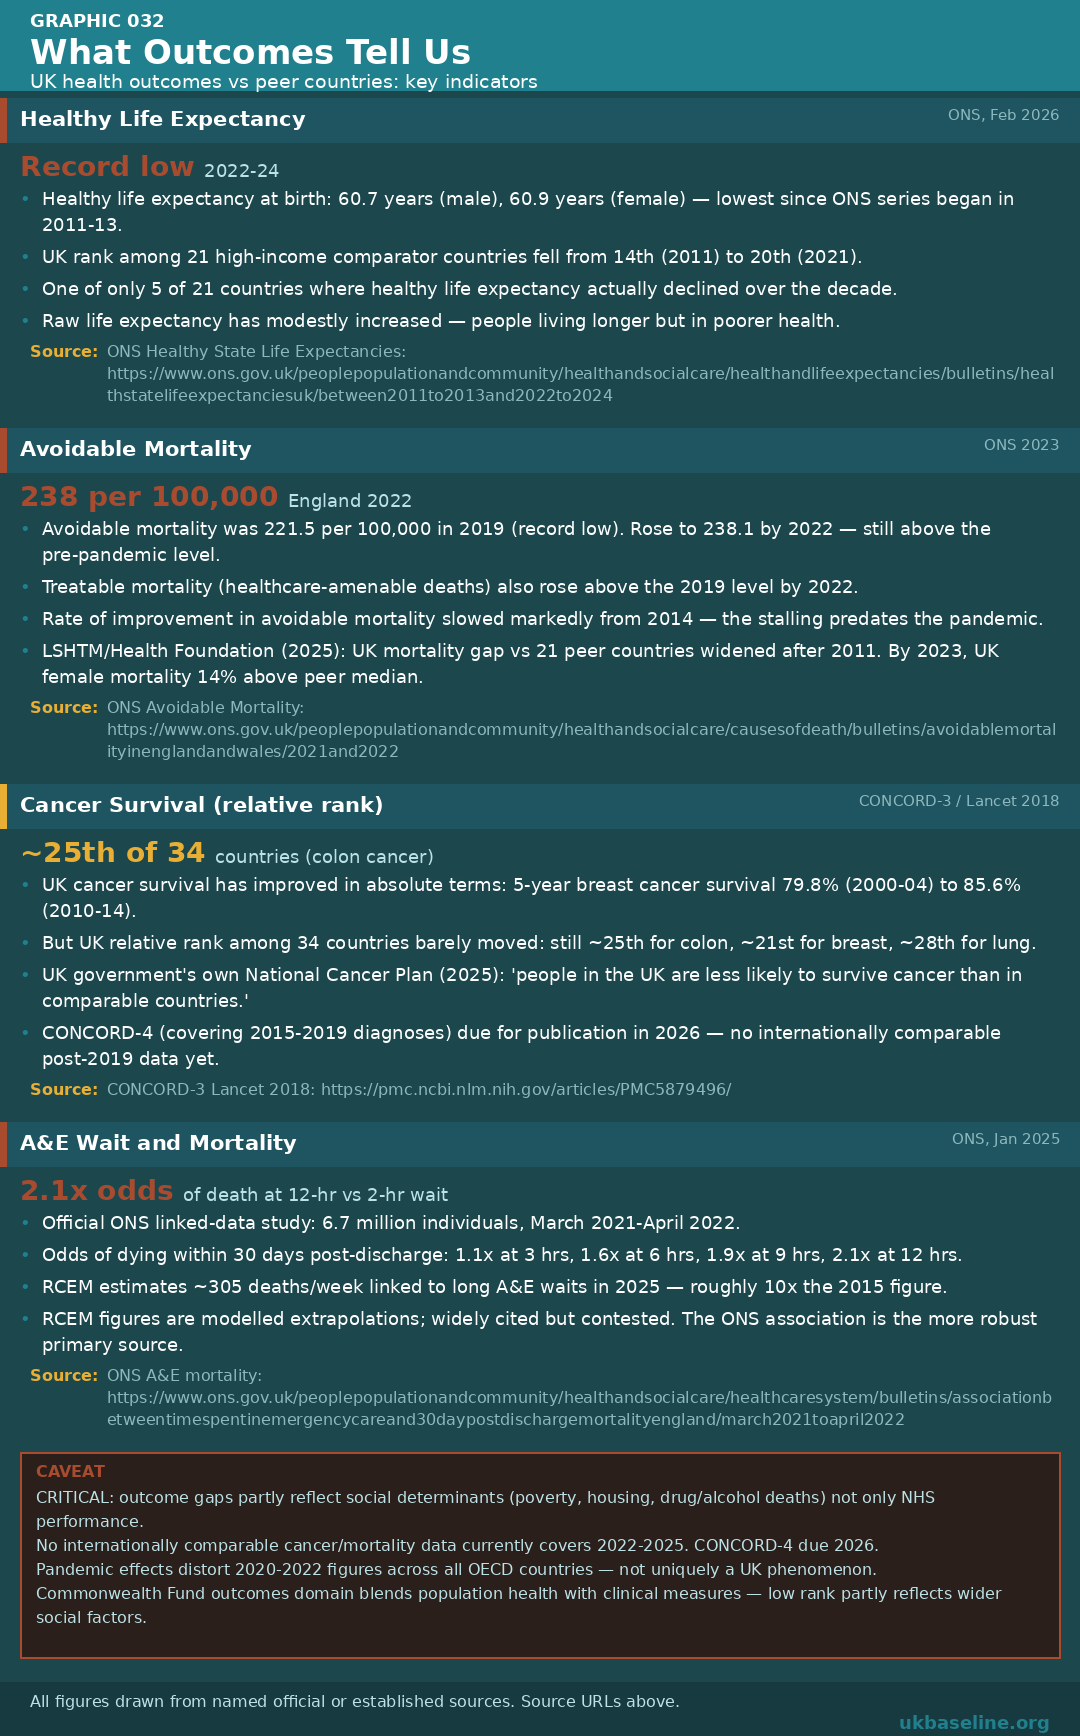
OBR savings forecasts for welfare reform are routinely revised and some reforms are subject to legal challenge. The £5.5bn figure reflects Spring Statement 2025 projections. Treat as a projection, not a guarantee.
What the Debt Figure Doesn’t Include
The headline Public Sector Net Debt (PSND) figure quoted by government and reported in the media is approximately £2.8 trillion. Alongside it sits a £1.4 trillion unfunded public sector pension liability — identified in the OBR’s own Fiscal Risks reports — which does not appear in the PSND headline under ESA10 accounting conventions. Combined, the two figures represent approximately 150% of UK GDP.
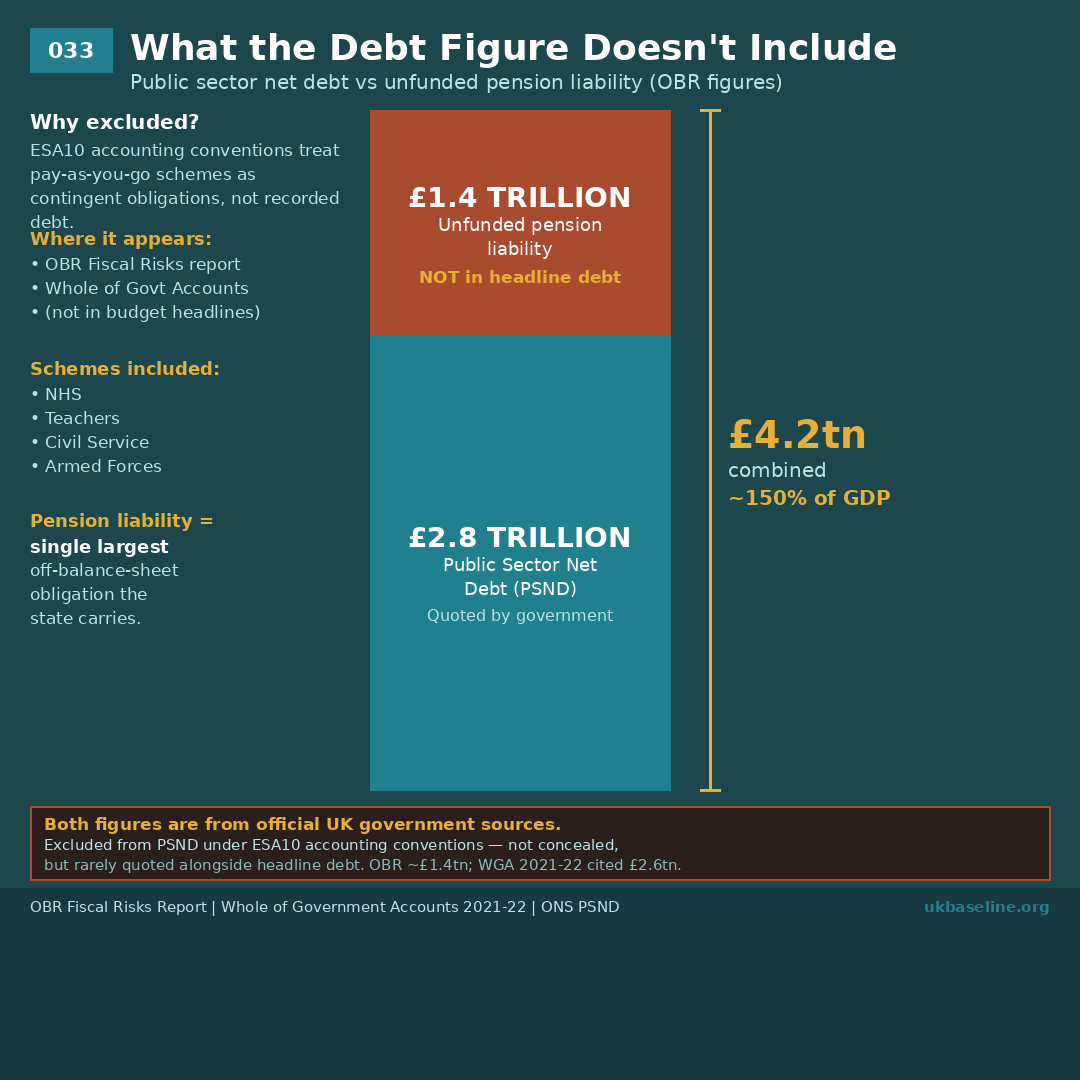
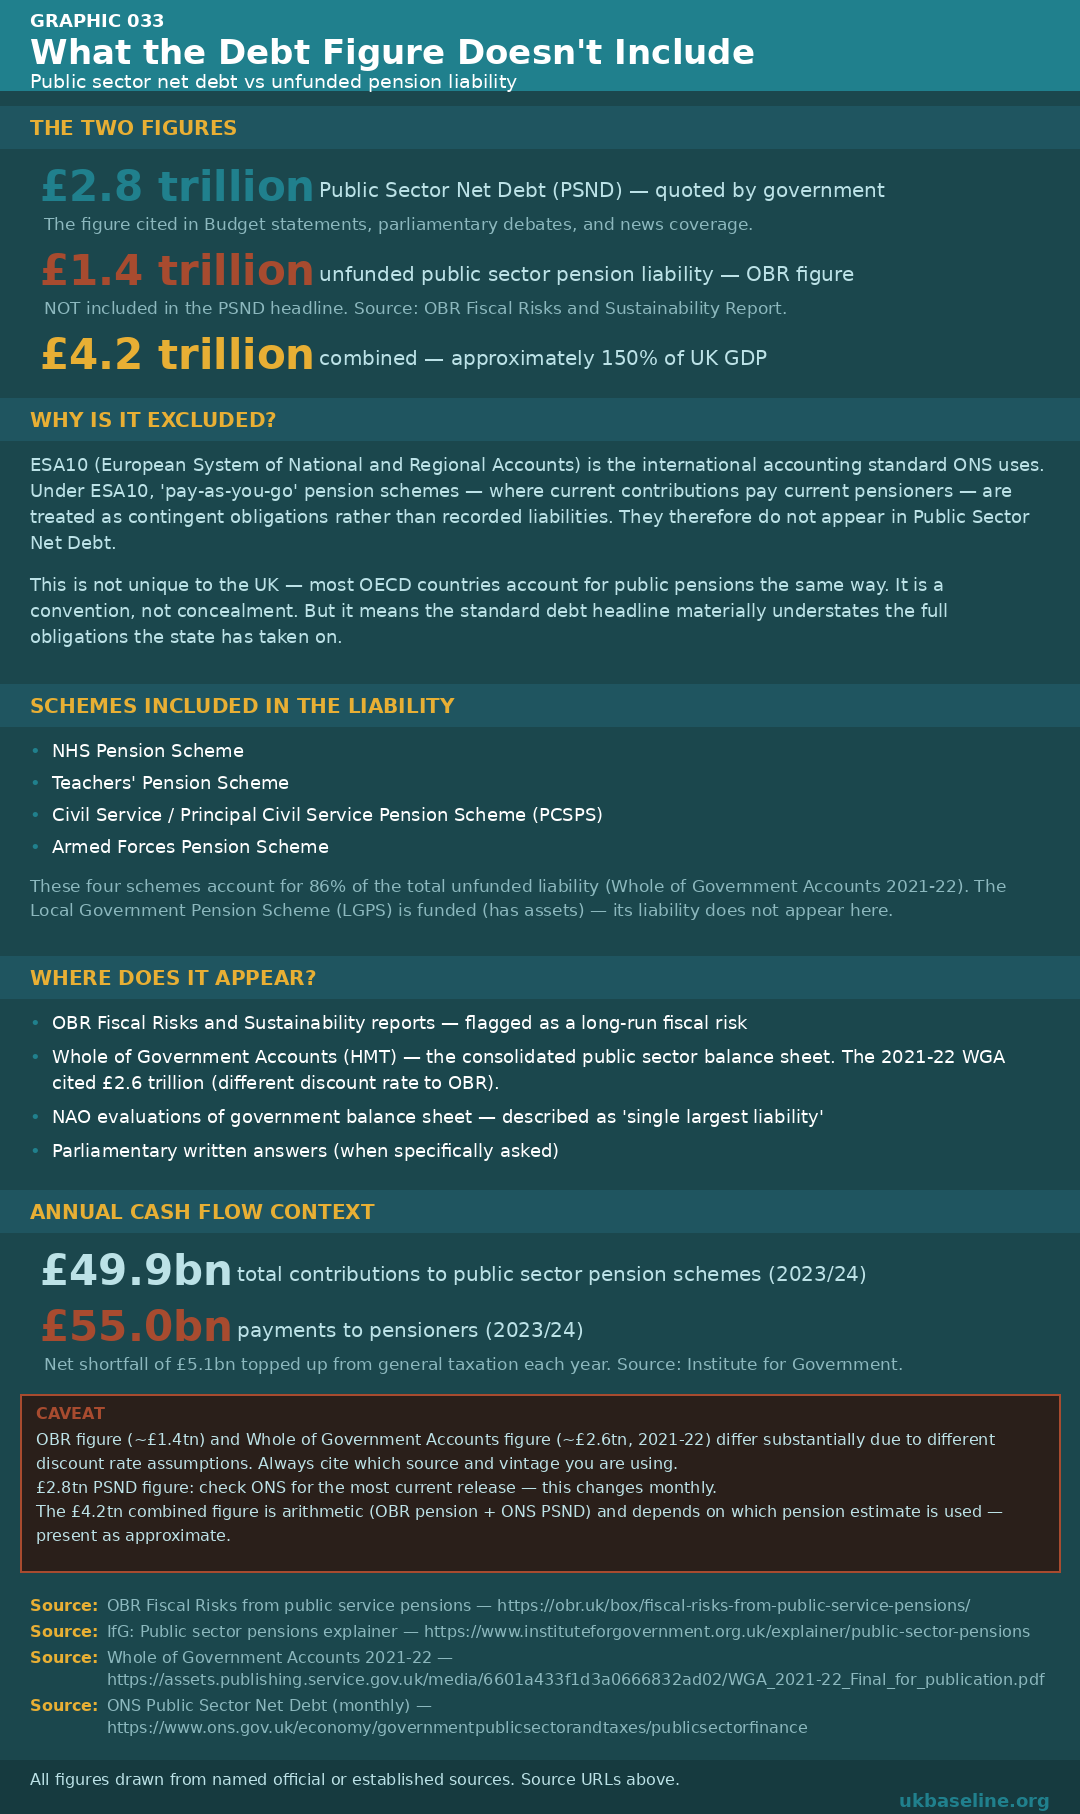
Both figures are from official UK government sources. The pension liability is excluded from PSND under ESA10 international accounting conventions — this is a classification convention, not concealment. The OBR cites approximately £1.4 trillion (most recent); the Whole of Government Accounts 2021–22 cited £2.6 trillion, reflecting different discount rate assumptions. Always cite the specific source and vintage when quoting either figure.
Data Sources
- Cabinet Office Civil Service Statistics 2025
- ONS Public Sector Employment UK: September 2025
- NHS England Digital Workforce Statistics: March 2025
- ONS Public Service Productivity Quarterly: Jul–Sep 2025
- ONS Healthy State Life Expectancies UK: 2011–13 to 2022–24 (Feb 2026)
- ONS Avoidable Mortality in England and Wales: 2021 and 2022
- ONS: Association between time in emergency care and 30-day mortality (Jan 2025)
- CONCORD-3: Global surveillance of cancer survival 2000–14 (Lancet, 2018)
- OECD Government at a Glance 2025
- OBR: Fiscal risks from public service pensions
- Institute for Government: Whitehall Monitor 2026
- HMT Whole of Government Accounts 2021–22
- Nuffield Trust: The NHS workforce in numbers
- LSHTM / Health Foundation: Trends in life expectancy and mortality (2025)