UK Public Spending — The Honest Numbers
Six single-topic graphics: total managed expenditure, spending as % of GDP, welfare composition, working-age disability payments, PIP by condition, and the full fiscal picture. Each with a creator cheat sheet.
Total UK public spending — the raw numbers
Total Managed Expenditure reached £1,347.2bn in 2025-26, up from £744.5bn in 2010-11. The largest single department is Social Protection at £322.6bn (24% of all spending), followed by Health at £236.7bn. Debt interest alone now costs £105.3bn — more than defence and education combined.
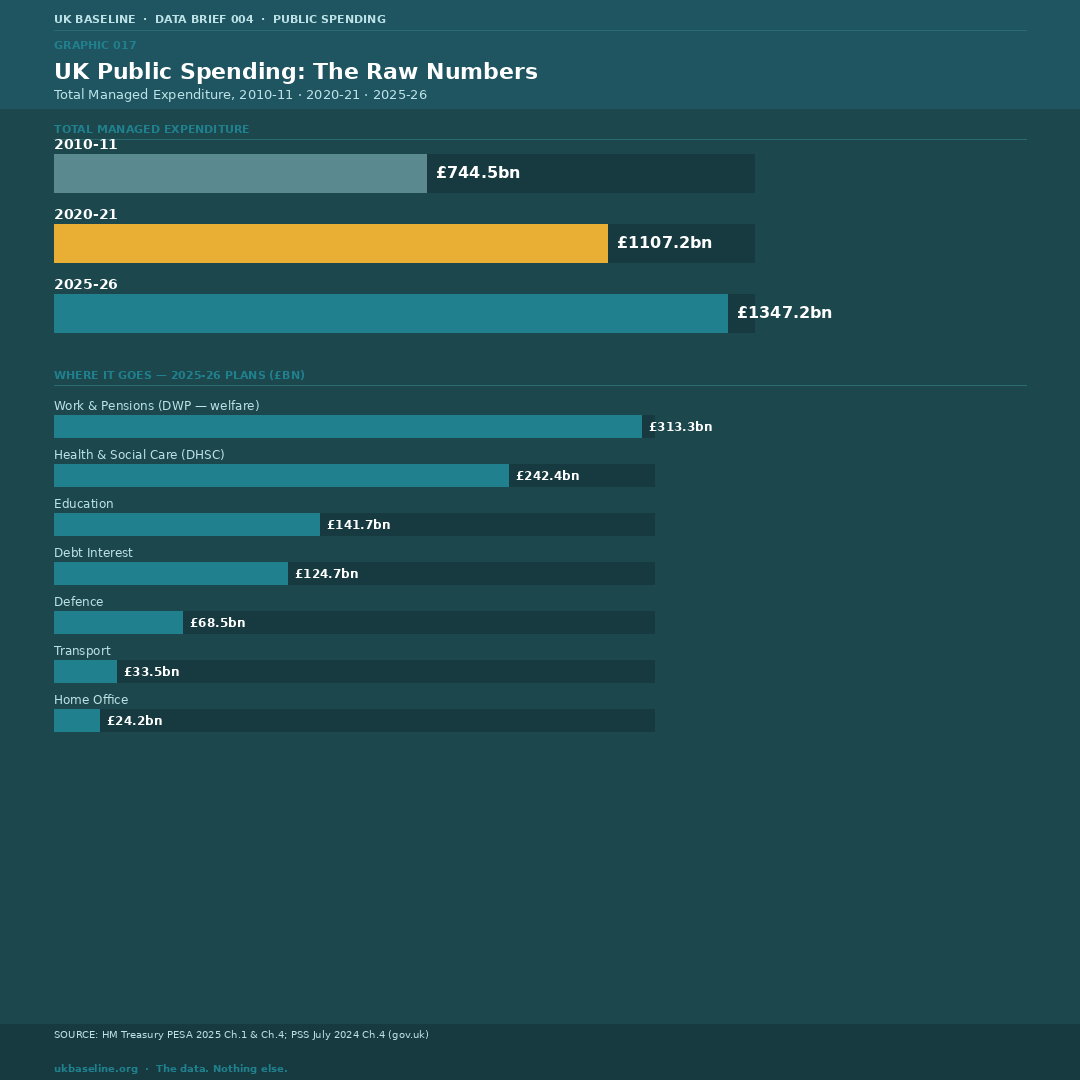
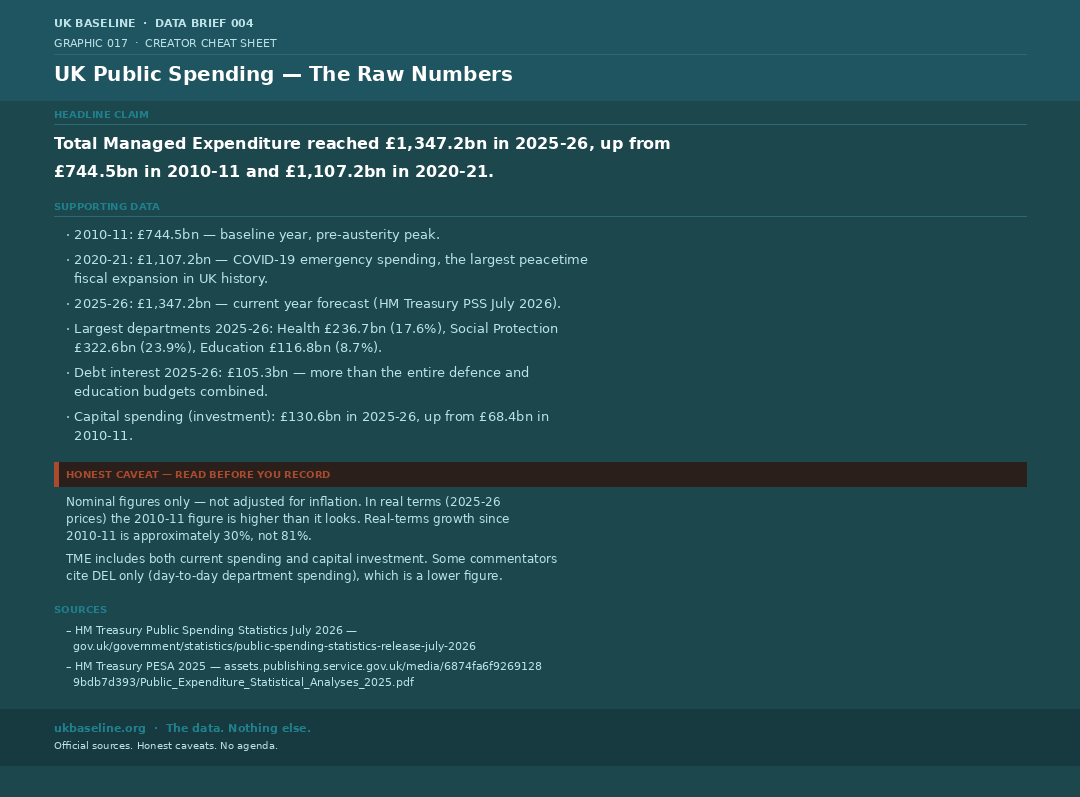
These are nominal figures — not adjusted for inflation. In real terms the 2010-11 figure is higher than it appears; real-terms growth since 2010-11 is approximately 30%, not the 81% implied by the nominal comparison. TME includes both current spending and capital investment. Some commentators cite DEL only (day-to-day department spending), which produces a lower headline number.
Spending as % of GDP — what the trend actually shows
At 44.3% of GDP in 2025-26, UK public spending is above its pre-pandemic level but well below the COVID-19 peak of 53.1% (2020-21) and the post-financial crisis peak of 46.5% (2009-10). The total level is not the story. What has changed is the composition — the share going to health, pensions, and disability has risen while defence, housing, and capital investment have fallen.
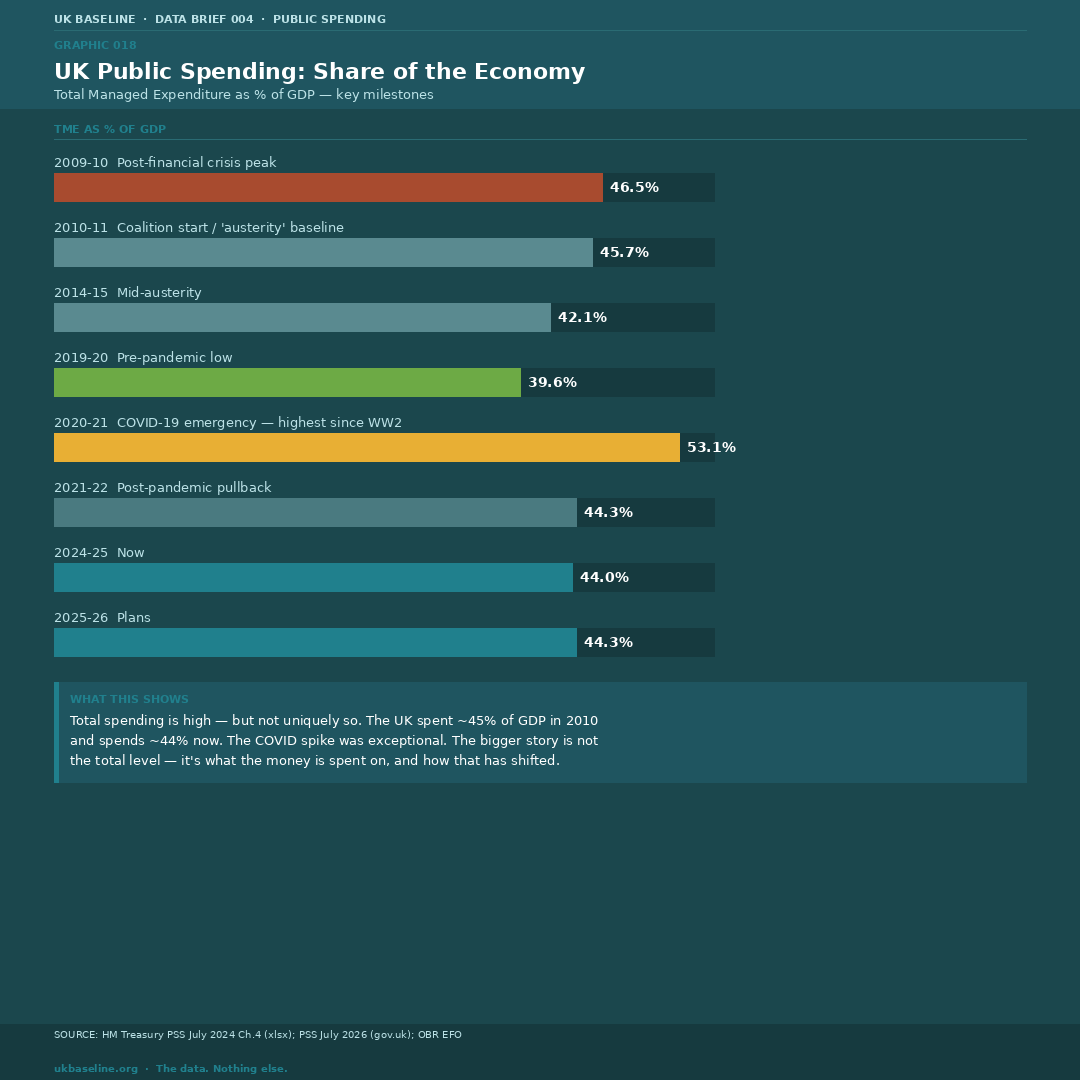
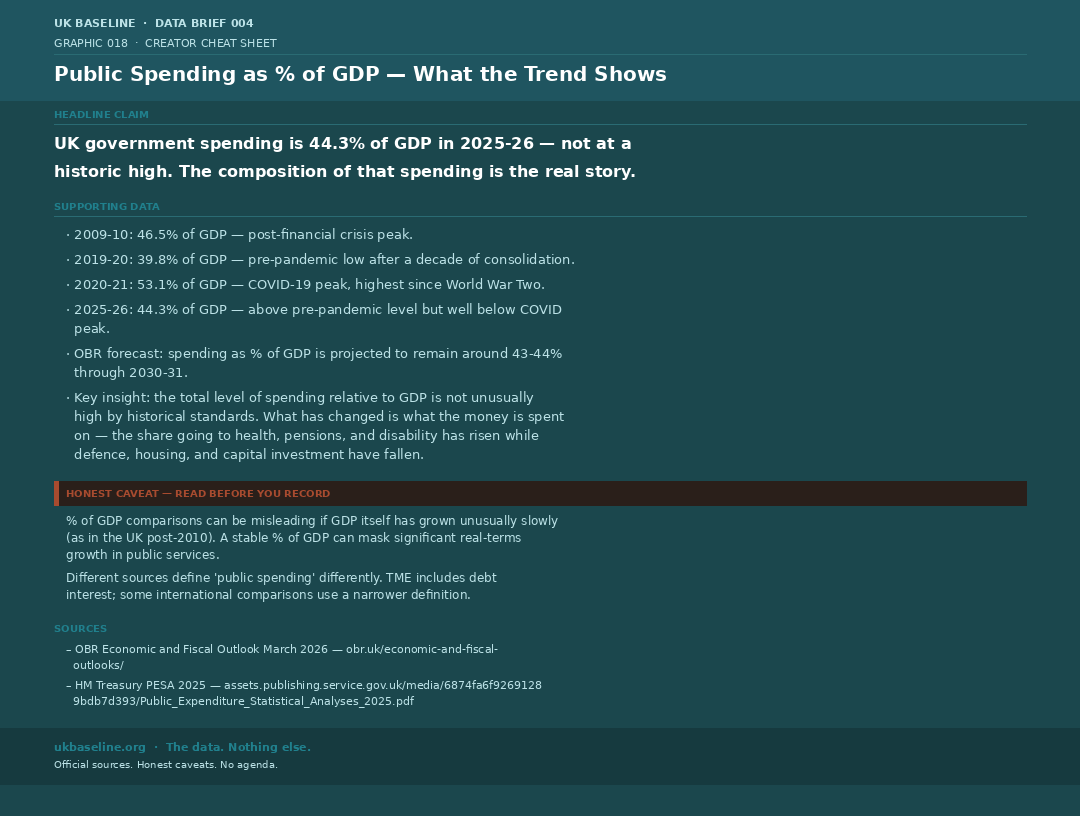
A stable percentage of GDP can mask significant real-terms growth if the economy itself has grown slowly — as in the UK post-2010. Different sources define public spending differently; TME includes debt interest which some international comparisons exclude. The OBR forecasts spending to remain around 43–44% of GDP through 2030-31.
Welfare spending — who actually gets it
The welfare bill is not primarily driven by working-age benefits. The State Pension accounts for £136.6bn — 47% of total welfare spending — and is protected by the triple lock. Working-age benefits (UC, JSA, legacy benefits) have actually fallen as a share of GDP from 2.8% in 2010 to 1.9% in 2025. The rise in the overall welfare bill is driven by demographic ageing and disability growth, not out-of-control working-age payments.
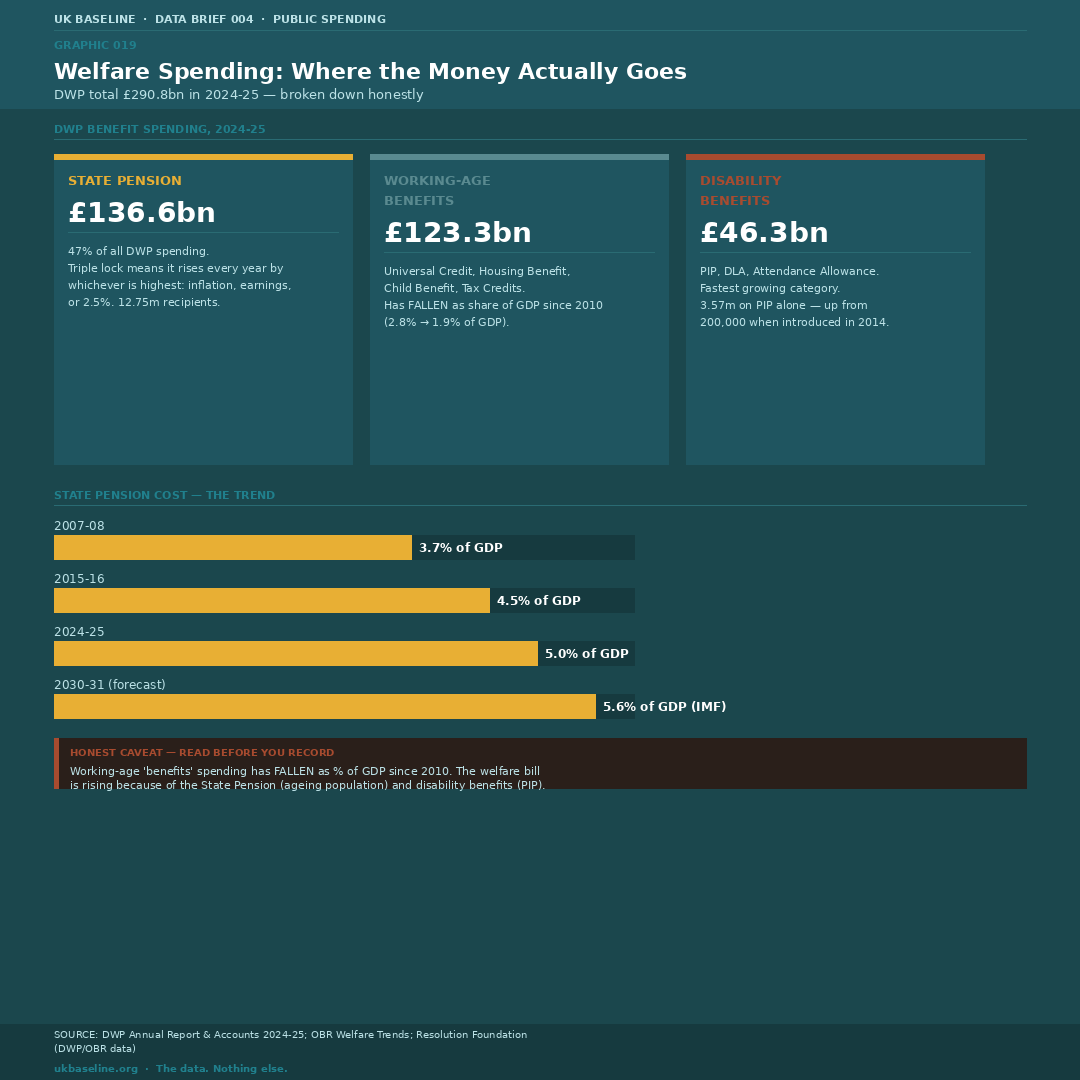
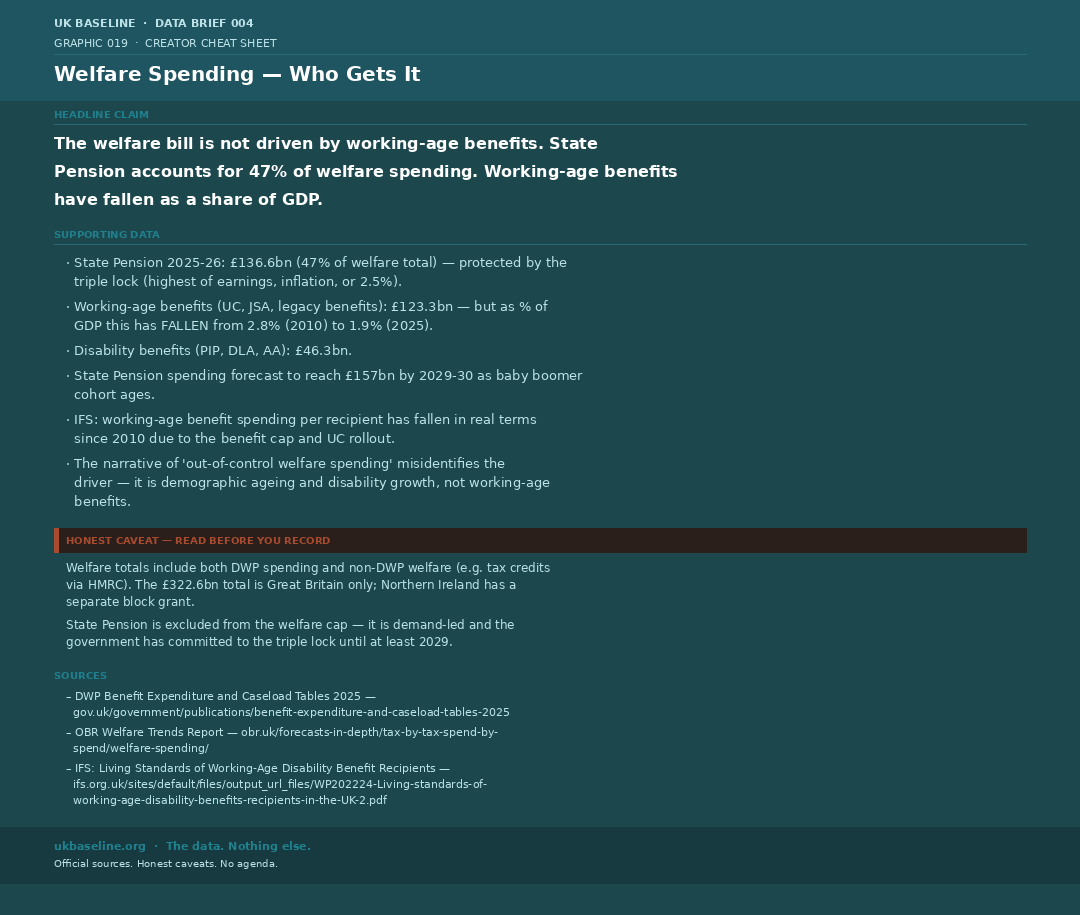
The welfare total includes both DWP spending and non-DWP welfare (e.g. tax credits via HMRC). The State Pension sits outside the welfare cap — the government has committed to the triple lock until at least 2029. The IFS has found that working-age benefit spending per recipient has fallen in real terms since 2010 due to the benefit cap and UC rollout. The rise in the welfare bill is a State Pension and disability story, not a working-age benefits story.
Working-age disability payments — the honest baseline
Working-age disability payments (DLA and PIP combined) grew from £7.4bn with 1.86 million claimants in 2012-13 to £22.6bn with 3.13 million claimants in 2024-25. That is a 205% rise in spending and 68% rise in caseload on a genuine like-for-like basis. The OBR forecasts £36.5bn with 4.42 million claimants by 2030-31. Four-fifths of the two-decade rise in recipients is attributable to psychiatric conditions.
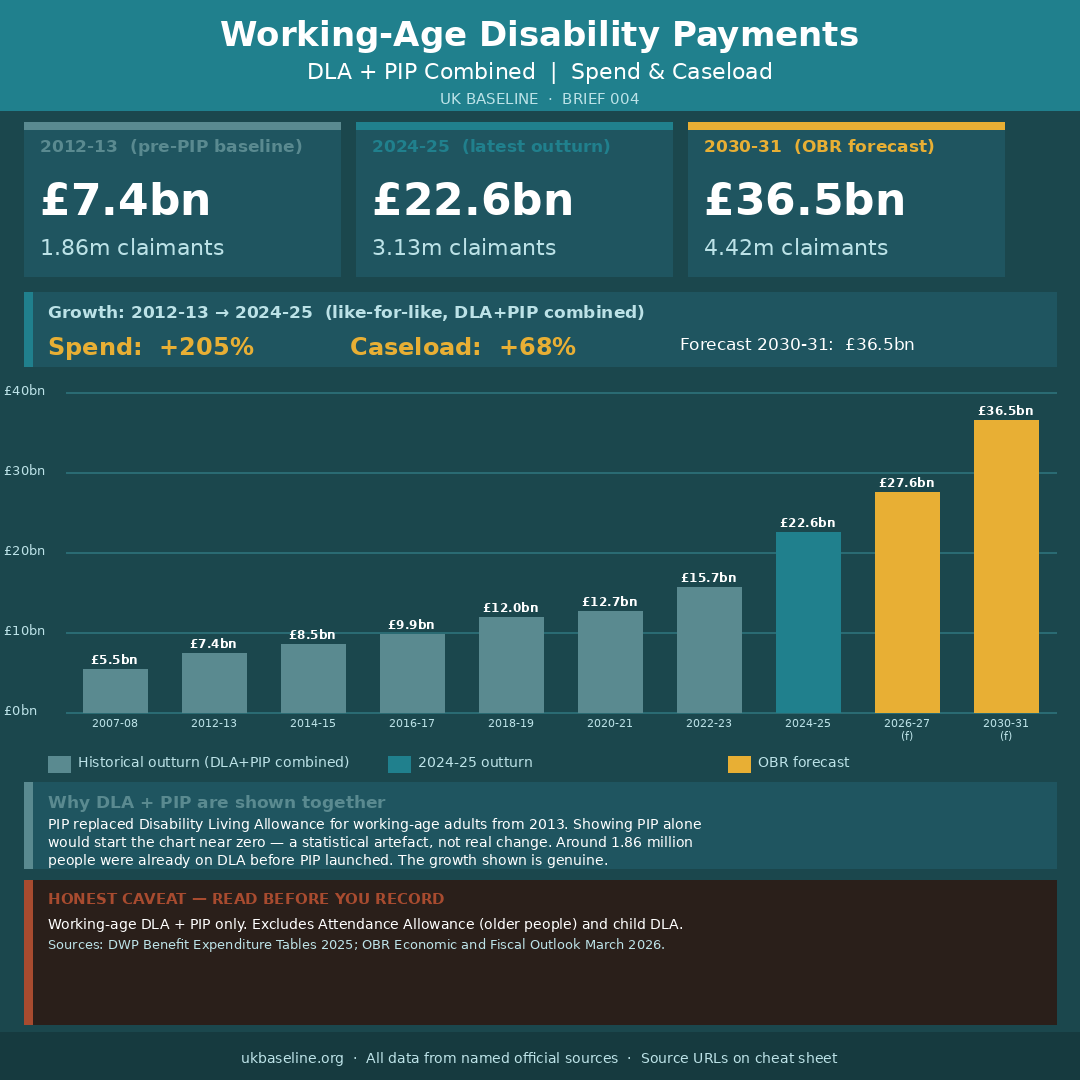
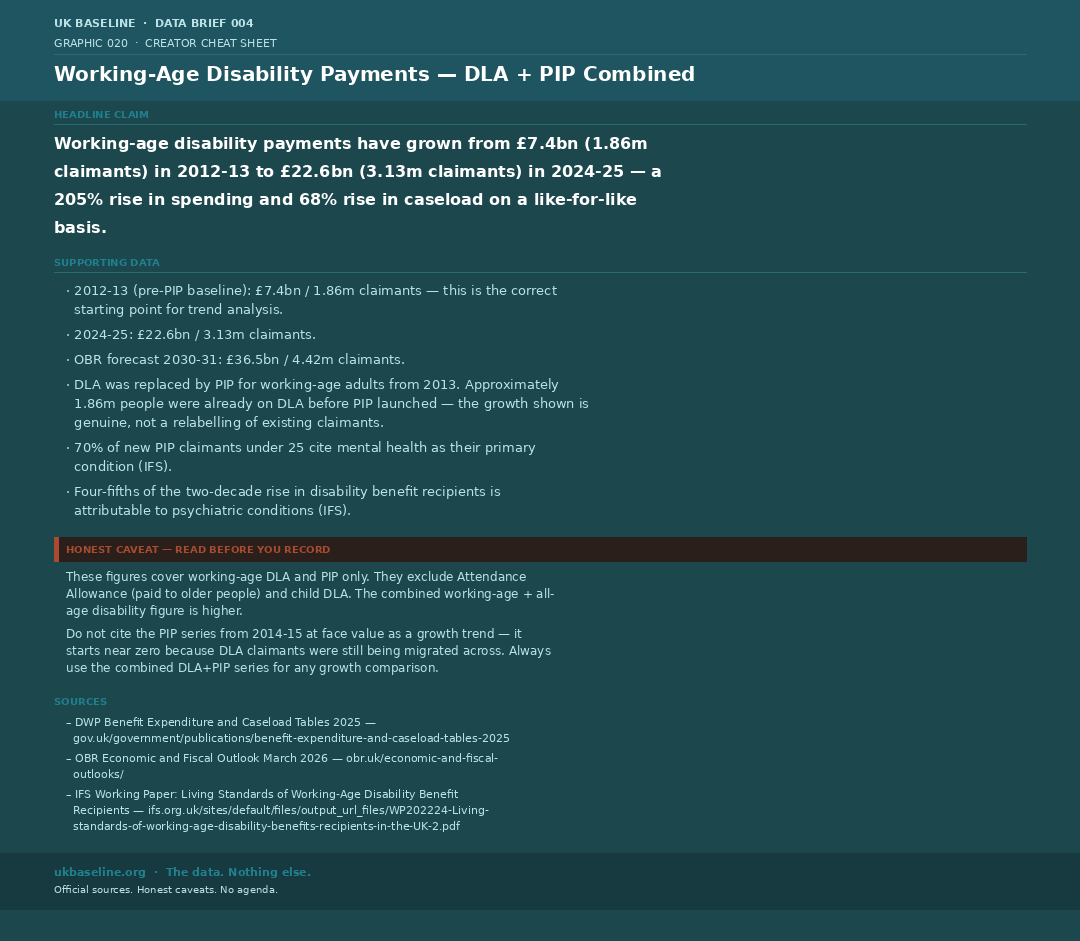
PIP replaced Disability Living Allowance for working-age adults from 2013. Approximately 1.86 million people were already on DLA before PIP launched — the growth shown is genuine, not a relabelling of existing claimants. Do not cite the PIP series from 2014-15 at face value as a growth trend: it starts near zero because DLA claimants were still being migrated across. Always use the combined DLA+PIP series for any growth comparison. These figures cover working-age only and exclude Attendance Allowance (paid to older people) and child DLA.
PIP by condition — the psychiatric shift
Psychiatric conditions account for 39% of all PIP claims as of January 2026 — the single largest category, larger than all musculoskeletal conditions combined. Mental health's share of disability benefit recipients has grown from 27% in 2002-03 to 44% in 2020-21. The IFS attributes four-fifths of the entire two-decade rise in disability benefit claimants to psychiatric conditions. 70% of new claimants under 25 cite mental health as their primary condition.
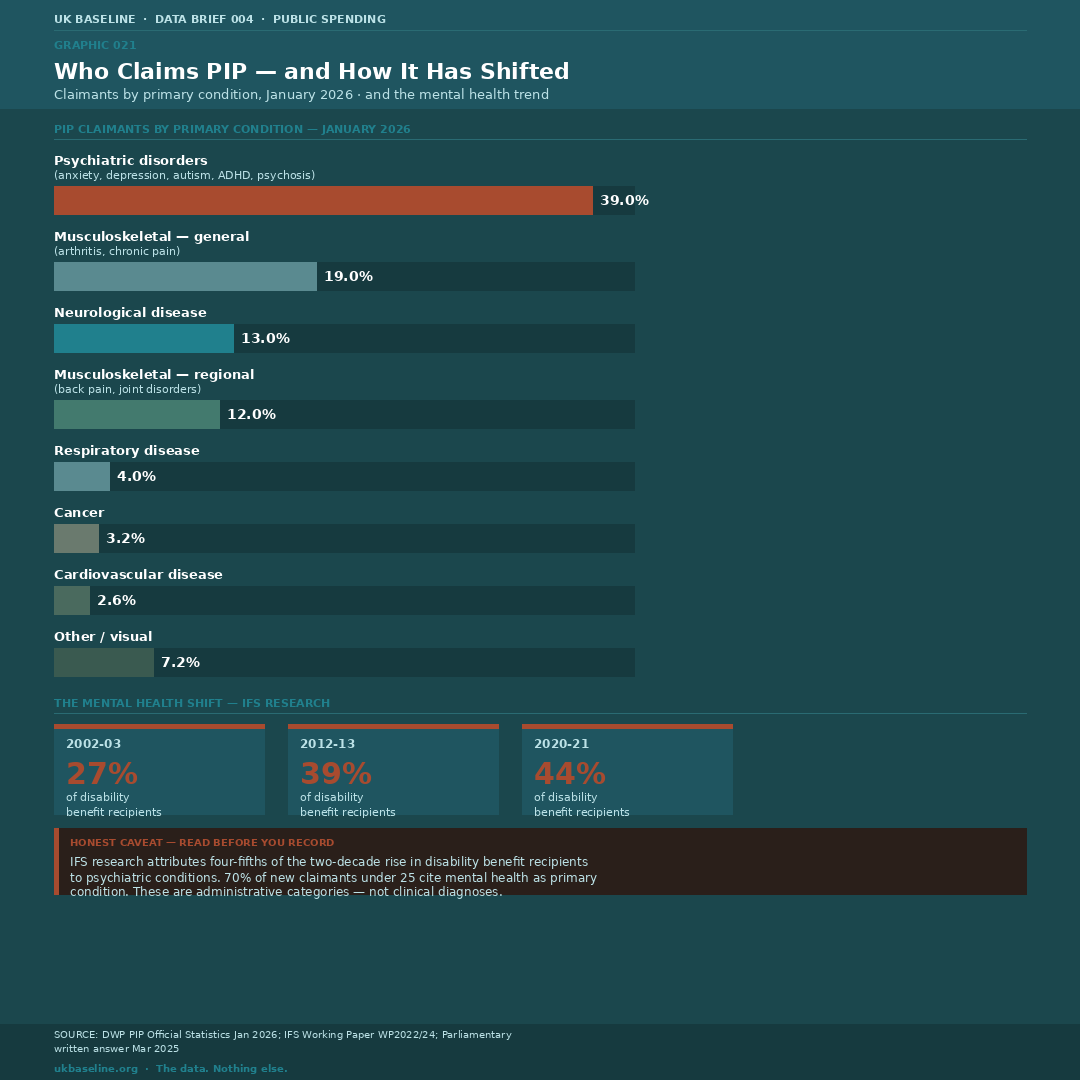
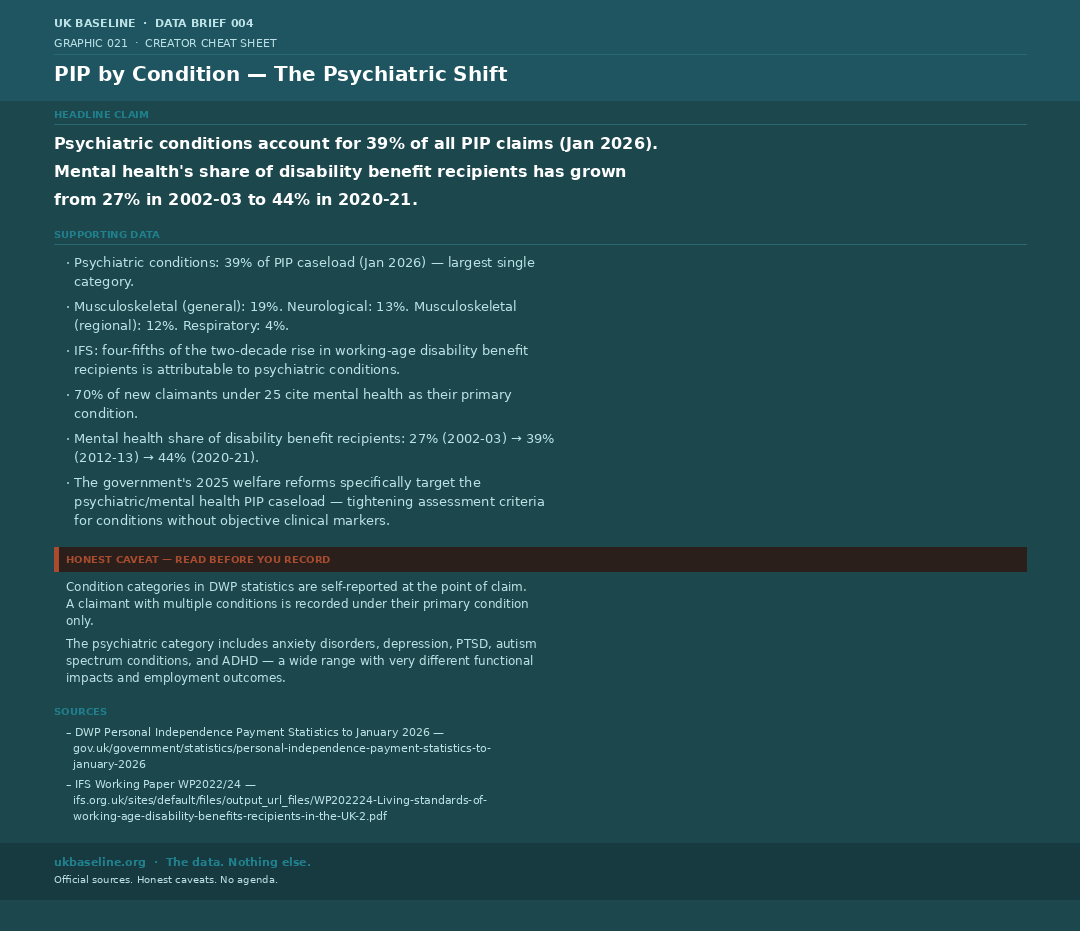
Condition categories in DWP statistics are self-reported at the point of claim. A claimant with multiple conditions is recorded under their primary condition only. The psychiatric category includes anxiety disorders, depression, PTSD, autism spectrum conditions, and ADHD — a wide range with very different functional impacts and employment outcomes. The government's 2025 welfare reforms specifically target the psychiatric/mental health PIP caseload by tightening assessment criteria for conditions without objective clinical markers.
The full fiscal picture — £22.6bn vs £75.7bn
PIP alone costs £22.6bn. The OBR's full health and disability benefits measure — which includes ESA and the UC health element (£19.1bn), housing benefit disability-linked costs (£13.0bn), Attendance Allowance (£8.4bn), Carer's Allowance (£3.8bn), and UC carer elements — totals £75.7bn in 2024-25. That is forecast to reach £90.9bn by 2028-29. Additional costs borne by local authorities — Council Tax Reduction for disabled claimants and SEND high-needs education spending (£12bn) — sit entirely outside these central government figures.
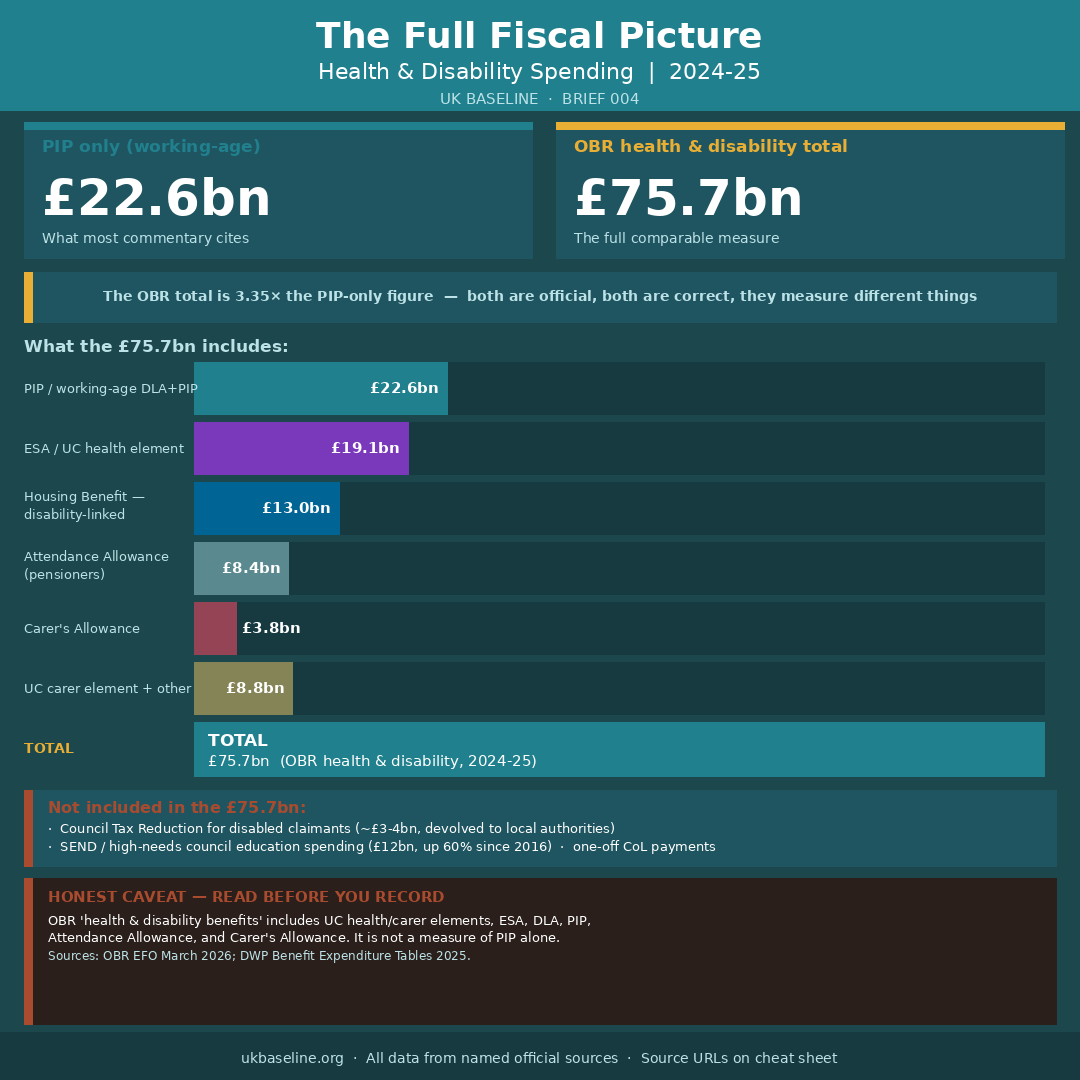
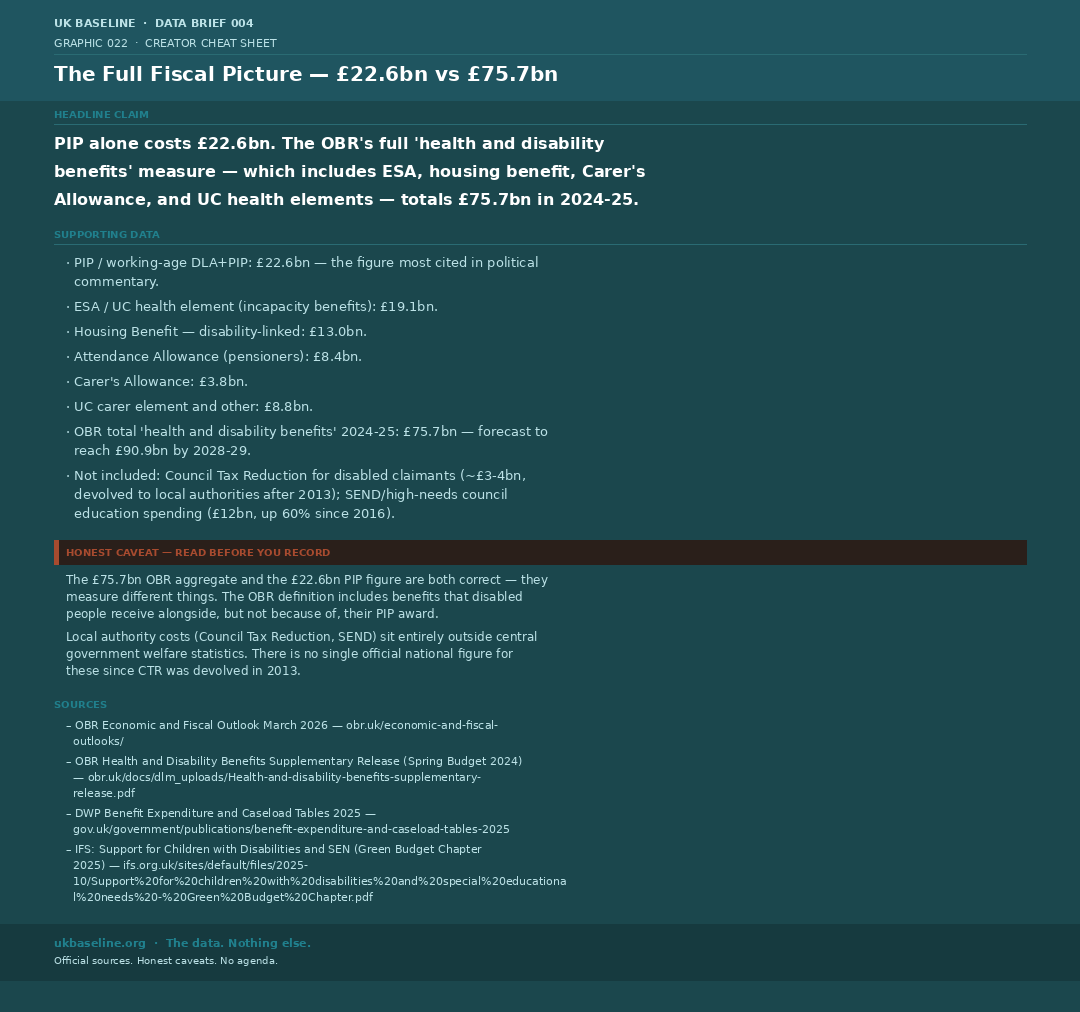
The £75.7bn OBR aggregate and the £22.6bn PIP figure are both correct — they measure different things. The OBR definition includes benefits that disabled people receive alongside, but not solely because of, their PIP award. Local authority costs (Council Tax Reduction, SEND) sit entirely outside central government welfare statistics. There is no single official national figure for Council Tax Reduction spending since it was devolved to local authorities in 2013.
Primary sources
- HM Treasury PESA 2025 — assets.publishing.service.gov.uk
- HM Treasury Public Spending Statistics July 2026 — gov.uk
- OBR Economic and Fiscal Outlook March 2026 — obr.uk
- OBR Health and Disability Benefits Supplementary Release — obr.uk
- DWP Benefit Expenditure and Caseload Tables 2025 — gov.uk
- DWP Annual Report and Accounts 2024-25 — assets.publishing.service.gov.uk
- DWP Personal Independence Payment Statistics to January 2026 — gov.uk
- IFS: Living Standards of Working-Age Disability Benefit Recipients — ifs.org.uk
- IFS: Support for Children with Disabilities and SEN — Green Budget Chapter 2025 — ifs.org.uk
- NAO DWP Overview 2024-25 — nao.org.uk