Archived — September 2026
This brief described welfare reforms that were withdrawn in July 2025 when the 4-point rule was removed from the Universal Credit Act before Royal Assent. The Timms Review — the independent review now determining the future of PIP — published its interim report on 9 July 2026, finding PIP “not fit for purpose.” Final recommendations are due autumn 2026. This brief will be updated once those recommendations are published. The underlying cost and caseload data remains accurate; the reform projections (Graphic 027) are now counterfactual. Timms Review →
The True Cost of a PIP Claim
The government's headline PIP figure is £22.6bn. But PIP is a gateway — it triggers Carer's Allowance, UC health elements, Council Tax Reduction, and more. This brief models the full co-occurring state cost per claimant, projects it across the caseload, and examines what the 2025 welfare reforms actually do to the trajectory.
This brief uses a Version B model: co-occurring state costs, not all PIP-caused. UC LCWRA, Carer's Allowance, and Council Tax Reduction figures are weighted by the percentage of PIP claimants who also receive each benefit. These entitlements may be payable without PIP in some cases. Attribution percentages draw on the most recent available data — some figures are from 2015. The Council Tax Reduction figure uses a pre-2013 national proxy; no current national figure exists. Housing Benefit disability premium is excluded because no national PIP-HB overlap percentage is published. All sources are named and linked on each cheat sheet.
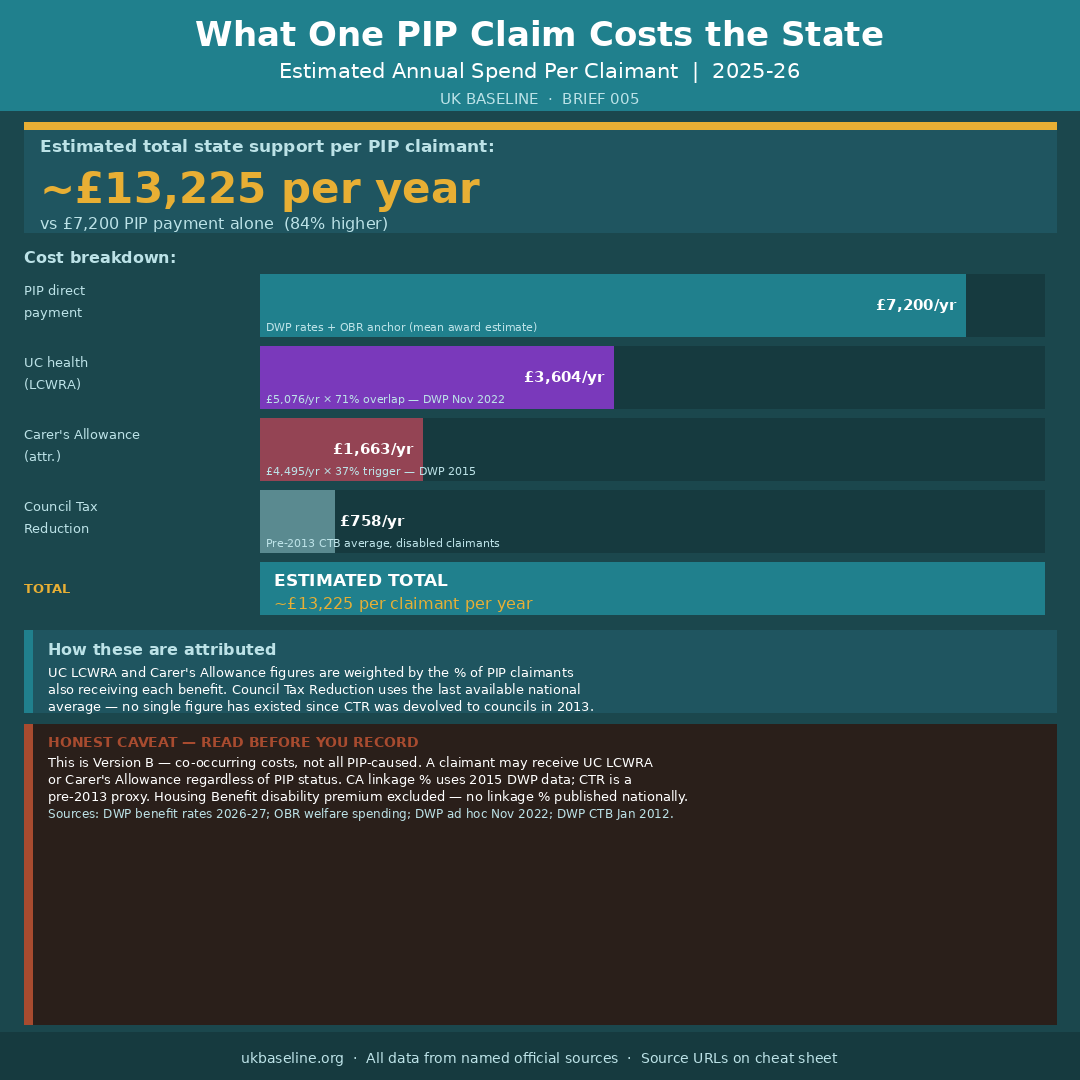
What One PIP Claim Costs the State
Per-claimant annual cost stack: PIP direct payment, UC LCWRA element, Carer's Allowance (attributed), and Council Tax Reduction (pre-2013 proxy). The ~£13,225 total is roughly 84% higher than the £7,200 PIP payment alone. Average PIP award derived via Stat-Xplore methodology and cross-checked against OBR anchor and spend÷caseload calculation — all methods converge at ~£7,200.
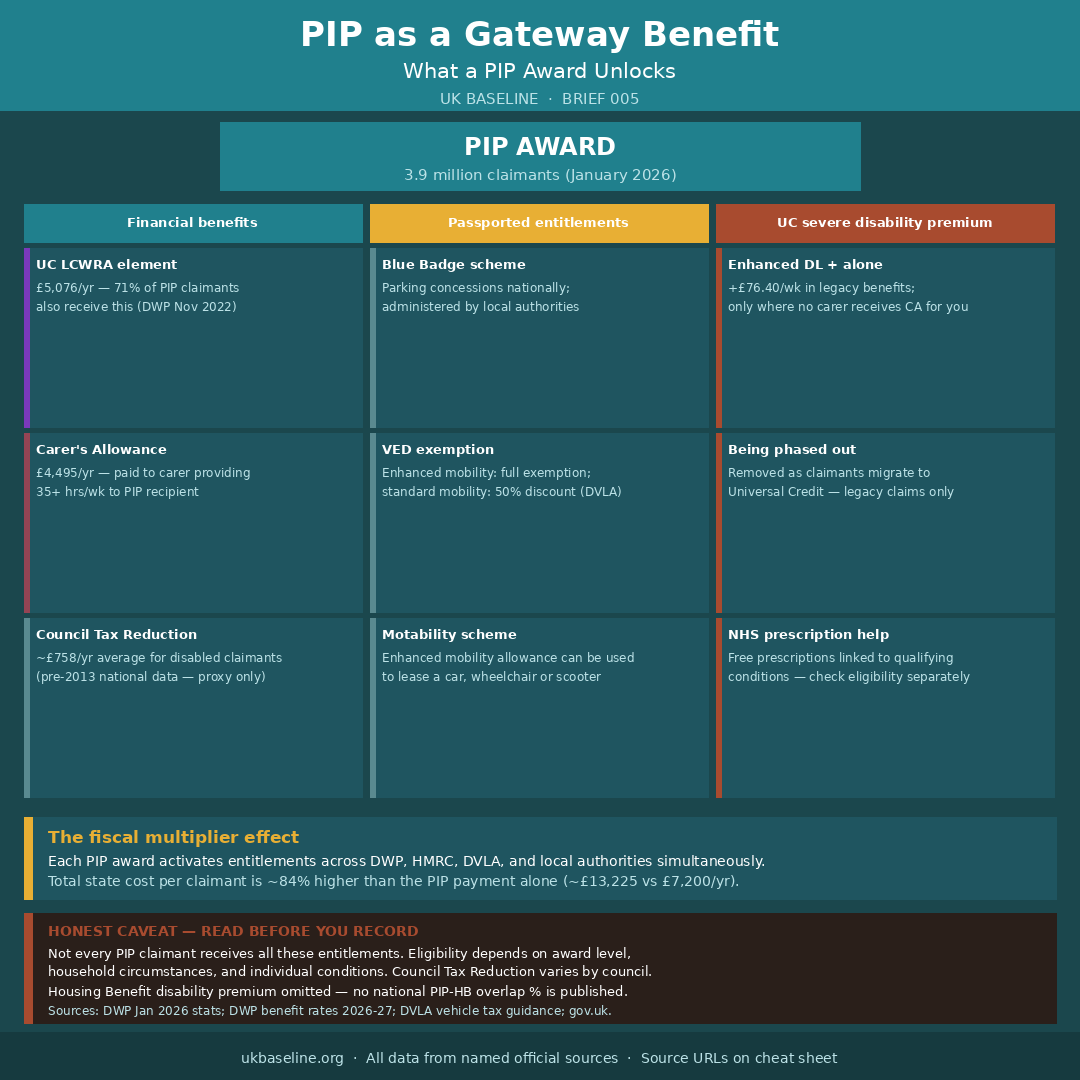
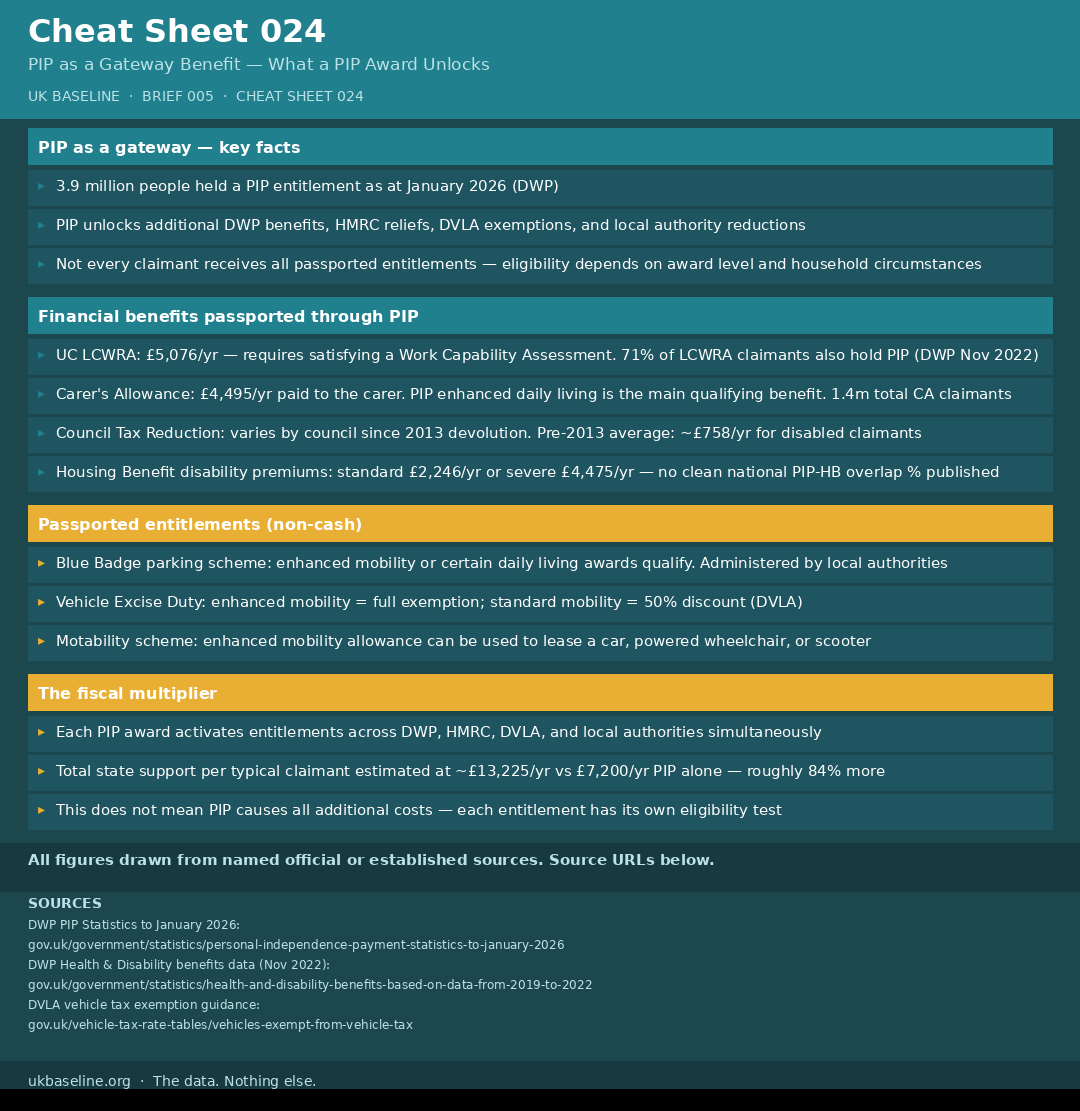
PIP as a Gateway Benefit
PIP is not just a payment — it unlocks entitlements across DWP, HMRC, DVLA, and local government. This graphic maps financial benefits (UC LCWRA, Carer's Allowance, CTR), passported entitlements (Blue Badge, VED exemption, Motability), and legacy UC severe disability premium. Each pathway carries its own eligibility test — not every claimant receives all of them.
The True Cost — Projected Across the Caseload
Applying the per-claimant multiplier (×1.84) to published PIP spend at three points in time: 2014-15 (£2.9bn estimated full cost), 2024-25 (£40.6bn), and 2030-31 (£65.7bn forecast). A grouped bar chart shows PIP-only vs estimated full state cost across all years. The caseload has grown 68% since 2014-15 and is forecast to grow a further 41% to 4.42m by 2030-31.
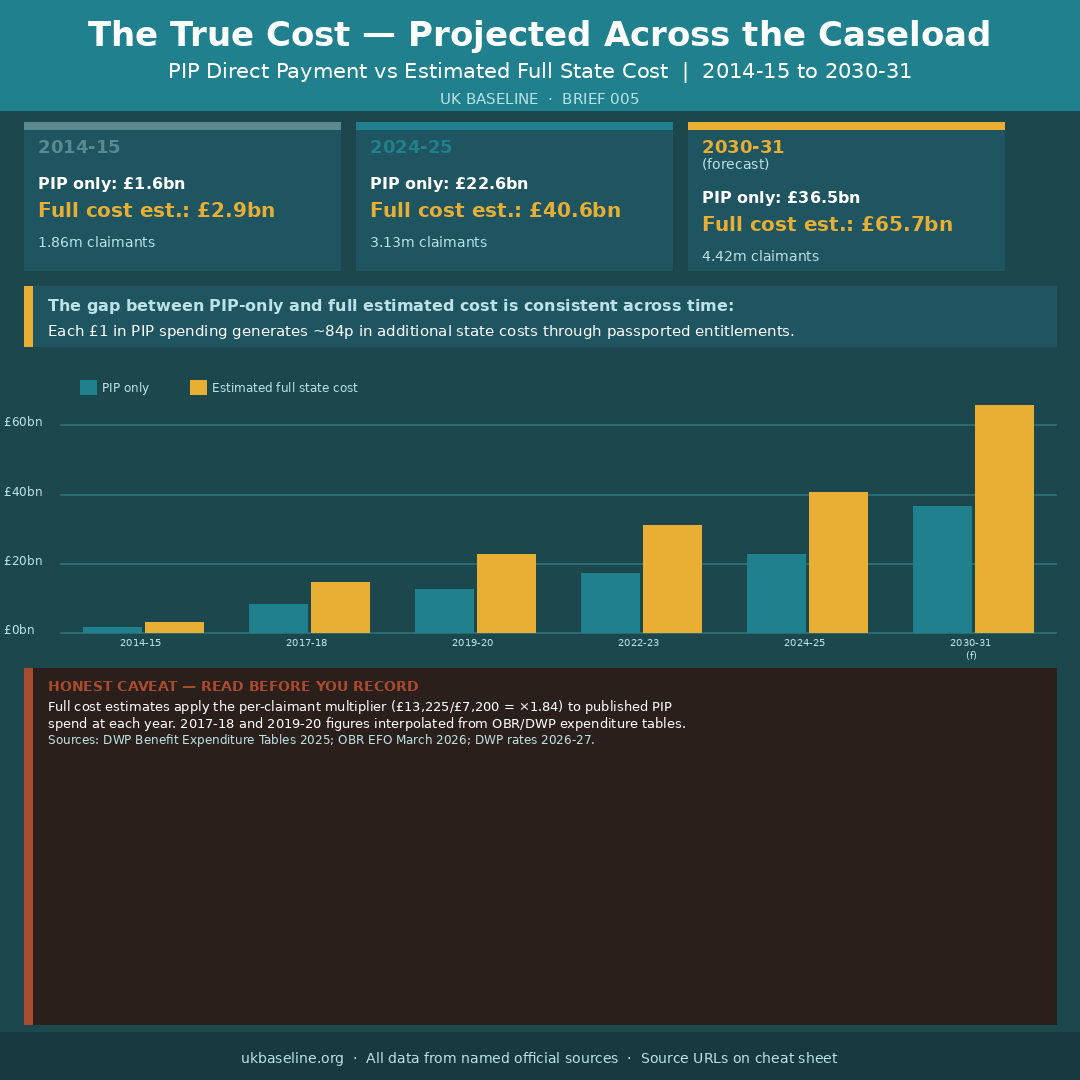
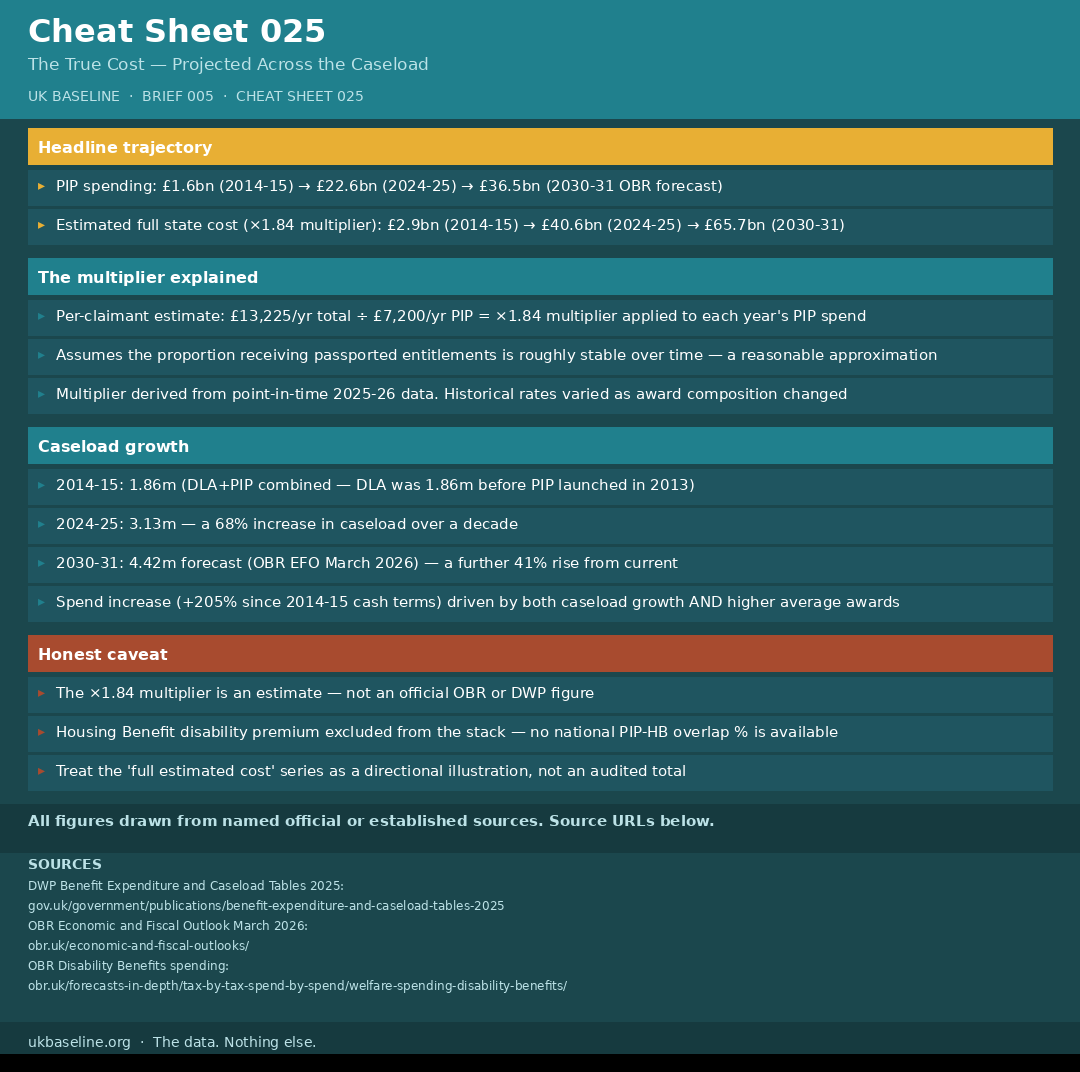
The ×1.84 multiplier is derived from point-in-time 2025-26 per-claimant estimates — it is not an official OBR or DWP figure. Treat the 'estimated full cost' series as a directional illustration of scale, not an audited total.
The Costs Councils Carry
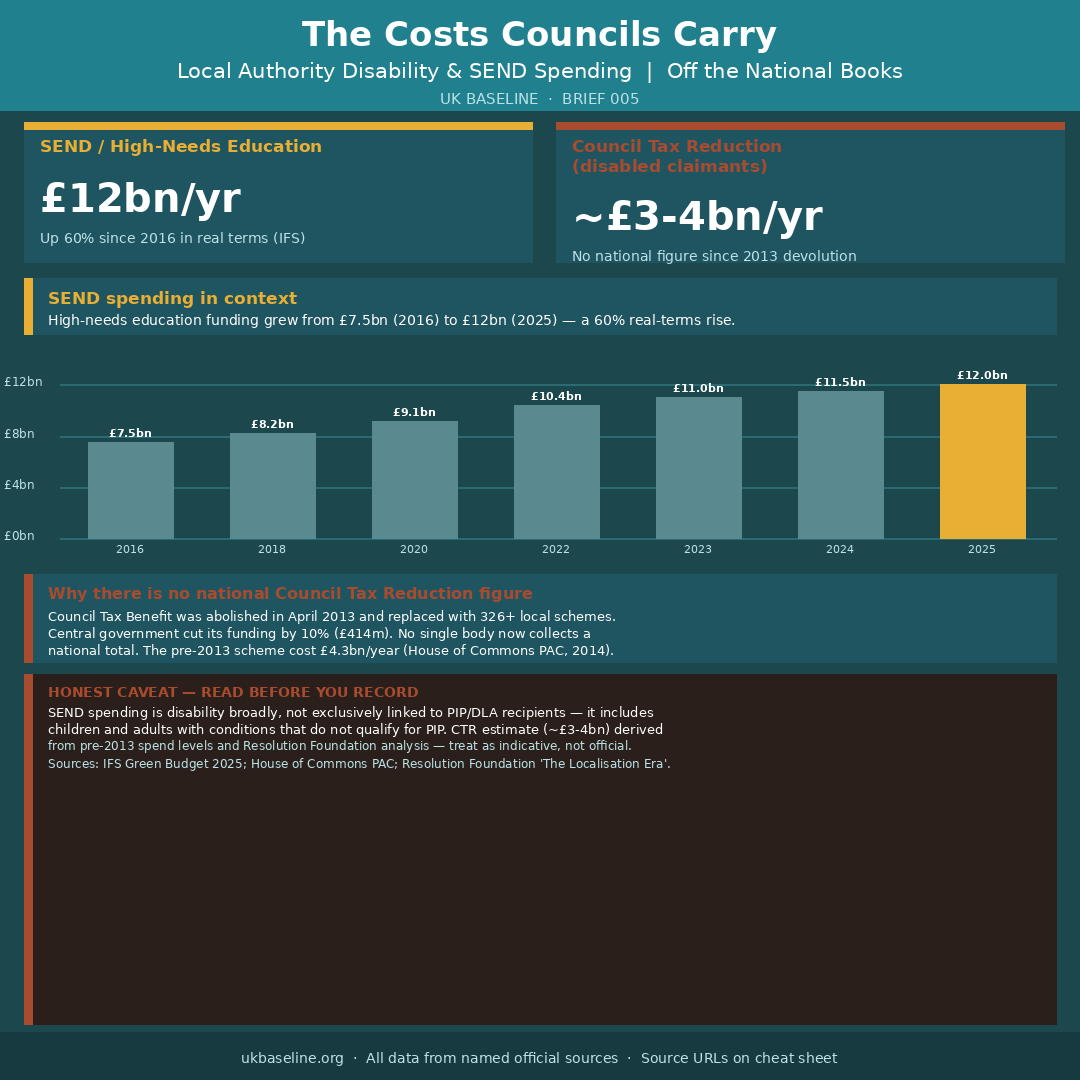
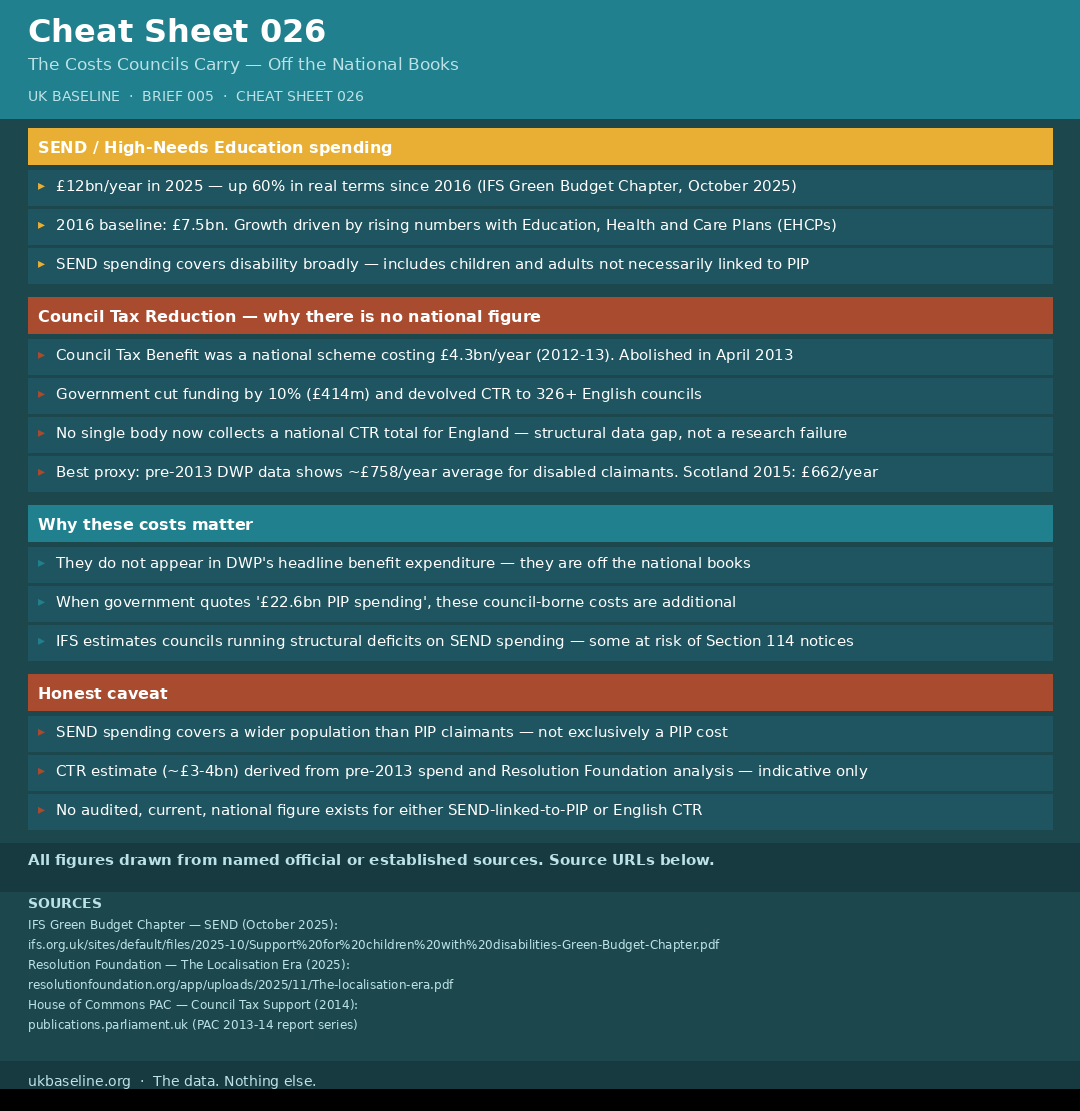
Two disability-linked cost lines that do not appear in DWP's headline figures: SEND/high-needs education spending (£12bn/yr, up 60% in real terms since 2016 per IFS) and Council Tax Reduction (~£3-4bn estimated, no current national figure exists). The CTR national scheme was abolished in 2013; central government data ends there. These costs are real but off the national books.
The Reform Question
The 2025 welfare reforms are projected by OBR to save ~£5.5bn by 2030-31 — roughly 12% of forecast PIP/disability spending. The reforms target psychiatric conditions specifically: 39% of PIP claimants list a mental health condition as their main condition; 70% of new under-25 claimants cite mental health. The OBR trajectory without reform reaches £44.9bn by 2030-31; after reform ~£39.4bn. The growth trend is slowed, not reversed.
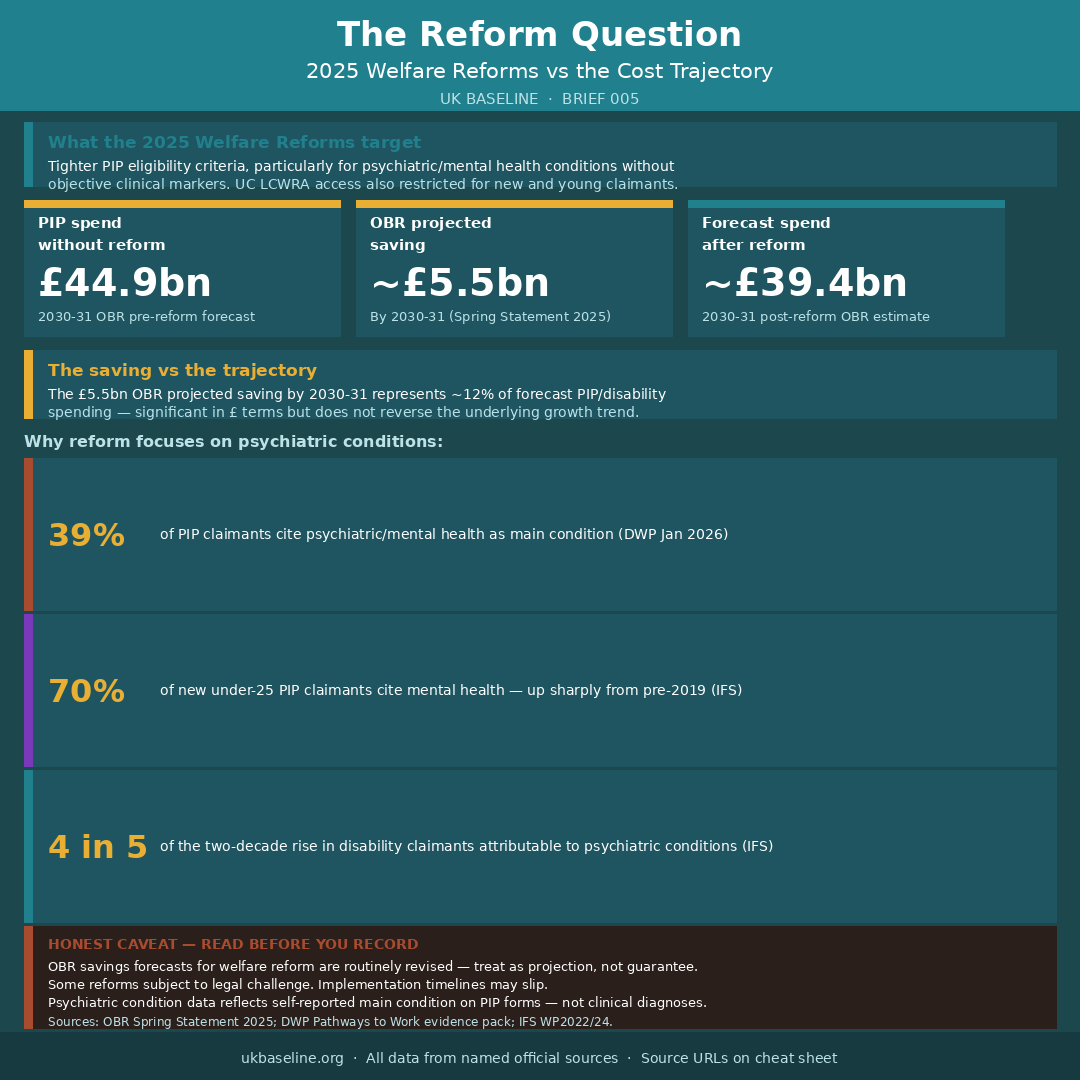
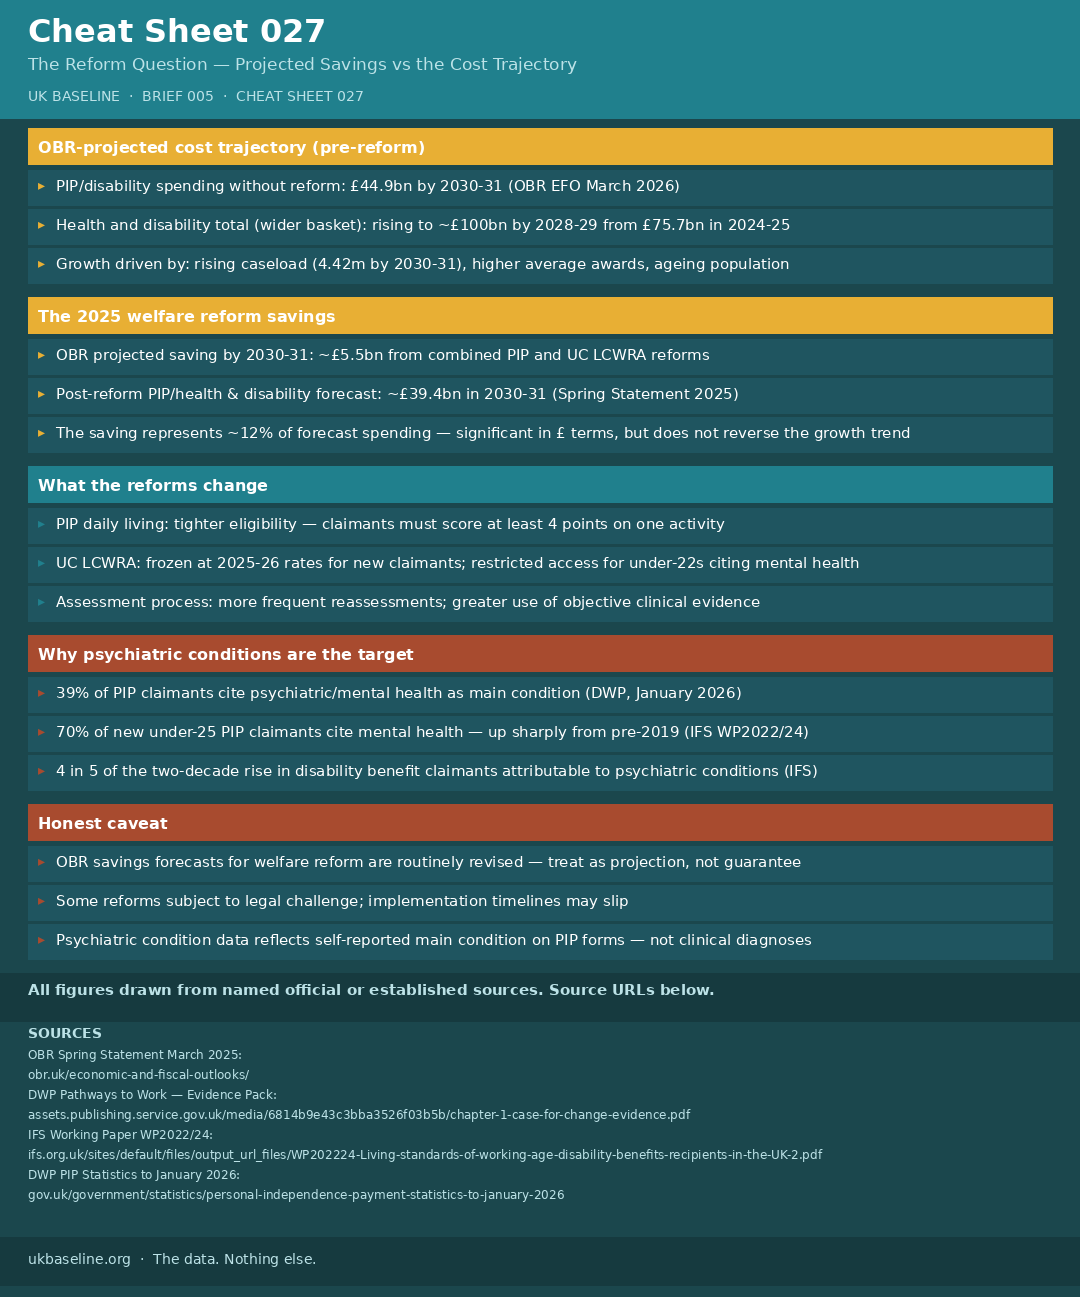
OBR savings forecasts for welfare reform are routinely revised and some reforms are subject to legal challenge. The £5.5bn figure reflects Spring Statement 2025 projections. Treat as a projection, not a guarantee.
Data Sources
- DWP Benefit and Pension Rates 2026-27
- DWP PIP Statistics to January 2026
- DWP Health and Disability benefits data 2019-2022 (November 2022)
- DWP Benefit Expenditure and Caseload Tables 2025
- DWP Pathways to Work — Evidence Pack
- OBR Disability Benefits spending page
- OBR Economic and Fiscal Outlook / Spring Statement 2025
- IFS SEND Green Budget Chapter (October 2025)
- IFS Working Paper WP2022/24 — Disability benefits
- Resolution Foundation — The Localisation Era (2025)
- DVLA Vehicle Excise Duty exemption guidance