The Annual Bill
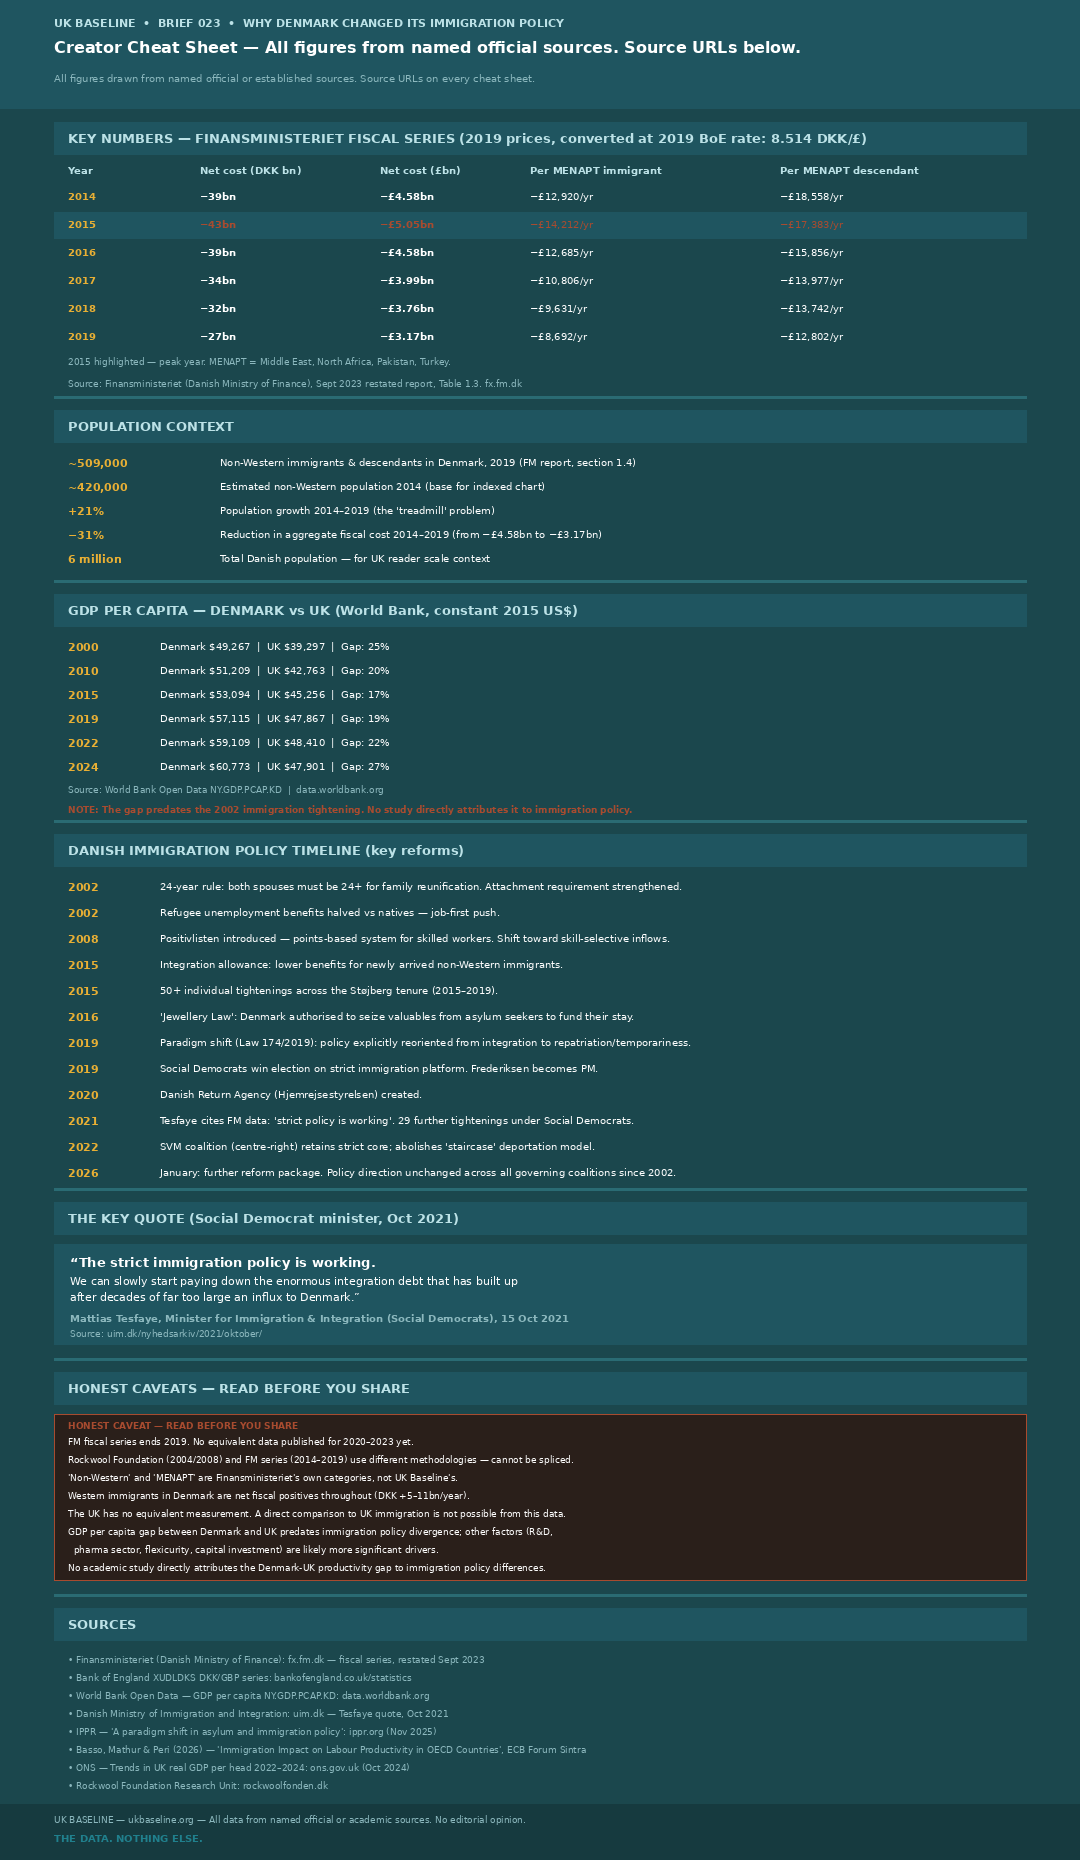
Denmark's Finansministeriet (Ministry of Finance) publishes an annual calculation of the net fiscal cost of immigration, broken down by origin. The most recent comprehensive restated series covers 2014 to 2019, at constant 2019 prices. For non-Western immigrants and their descendants — a category the ministry defines to include those from the Middle East, North Africa, Pakistan, Turkey, and equivalent regions — the figures are as follows.
Net fiscal cost means the difference between taxes paid and the cost of public services used — healthcare, education, housing support, policing, and benefits. A negative figure means the group costs the state more than it contributes in tax. Western immigrants to Denmark — broadly, those from EU/EEA, North America, and Australasia — are net fiscal positives throughout the same period, contributing between +DKK 5bn and +DKK 11bn per year. The non-Western cost and the Western contribution partially offset each other; it is the non-Western figure that drives the policy debate.
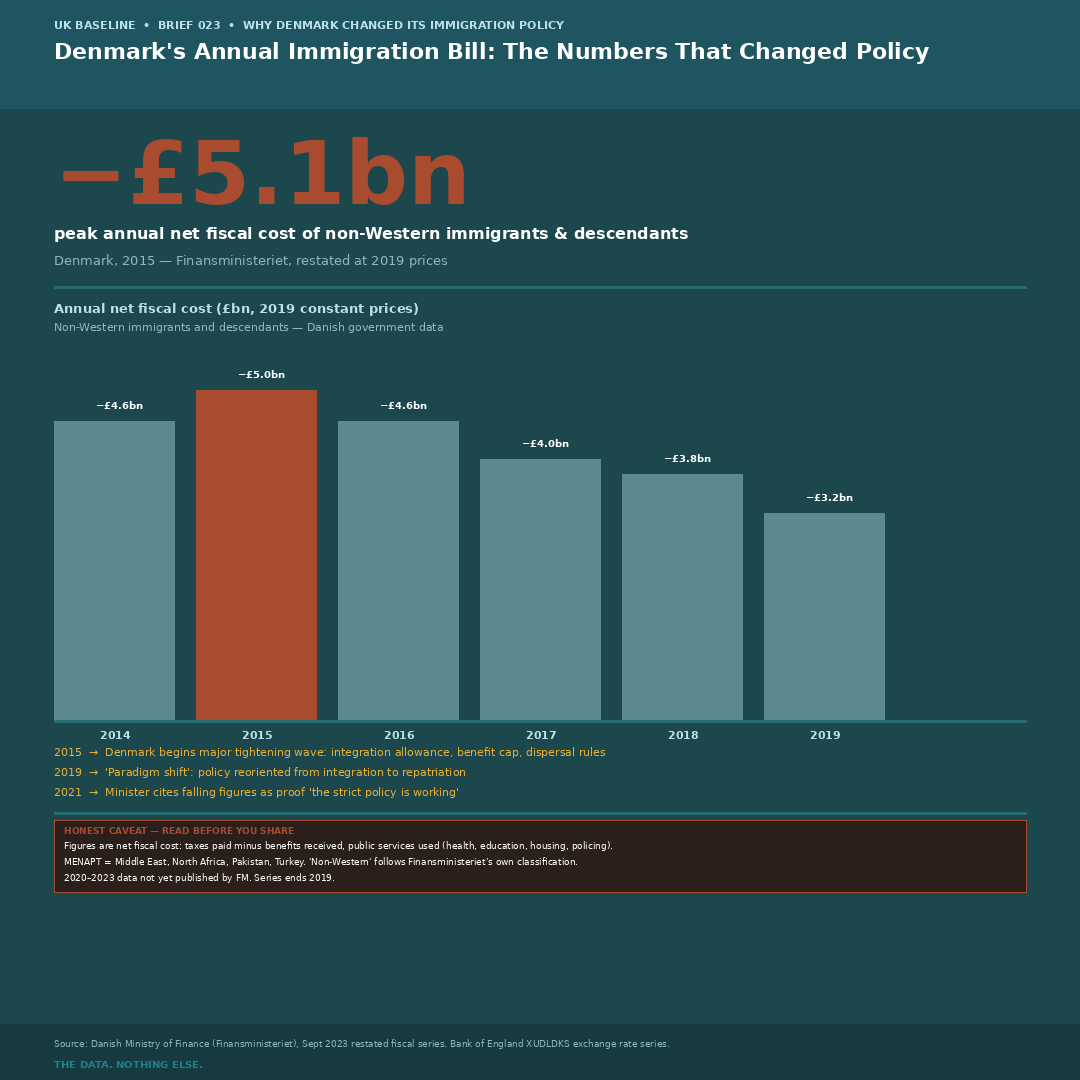
The FM series uses 2019 constant prices throughout, so the figures are directly comparable year to year. Earlier data from the Rockwool Foundation (2004: −£1.2bn; 2008: −£1.0bn) uses a different methodology and cannot be spliced into this series. The FM series has not been updated with 2020–2023 data as of August 2026. The classification "non-Western" follows the Finansministeriet's own published categories — it is their term, not an editorial choice by UK Baseline.
What Each Person Costs
The aggregate figures become more meaningful when broken down per person. Denmark's Finansministeriet also publishes average net fiscal cost per individual, distinguishing between the first generation (immigrants themselves) and the second generation (their descendants, born in Denmark or arrived as young children).
In 2014, the average first-generation MENAPT immigrant cost the Danish state −£12,920 per year in net fiscal terms. By 2019, that figure had fallen to −£8,692 — a reduction of 33% over five years. The direction of travel is clear: integration is measurably improving, and each individual costs less over time. That is a genuine and important finding, and Denmark's data shows it.
The second-generation figures tell a more complicated story. Descendants of MENAPT immigrants cost −£18,558 per person in 2014, falling to −£12,802 by 2019. Two things are notable. First, the improvement is real and consistent. Second, descendants cost substantially more per person than their parents — despite being raised in Denmark, educated in Danish schools, and eligible for the same employment pathways. The explanation lies partly in settled-status welfare eligibility expanding with permanent residency, and partly in occupational sorting: second-generation MENAPT workers remain concentrated in lower-wage sectors at higher rates than either the native Danish population or Western-origin immigrants.
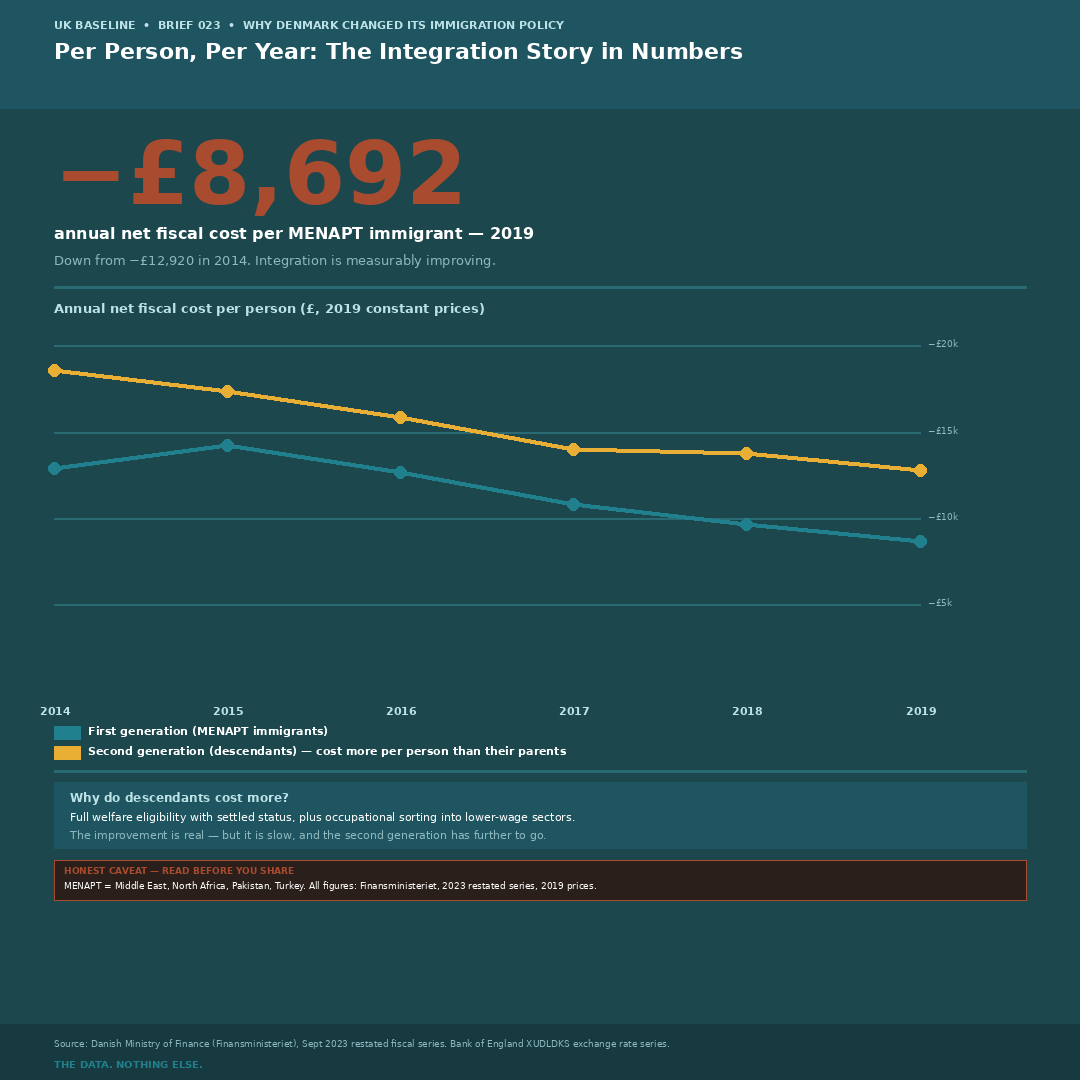
MENAPT = Middle East, North Africa, Pakistan, Turkey — a Finansministeriet classification. Per-person figures are averages across the entire group and conceal substantial variation within it. Some MENAPT-origin individuals are net fiscal contributors. The figures measure net fiscal cost only — they do not capture broader economic contributions such as care provision, GDP effects, or labour market gaps filled.
The Treadmill Problem
The most important finding in the FM data is not the raw cost — it is the relationship between improving per-person outcomes and the aggregate bill. Between 2014 and 2019, the non-Western population in Denmark grew by approximately 21%. Over the same period, the aggregate net fiscal cost fell by 31%. Integration is winning — but slowly, because it is running against a growing denominator.
This dynamic is why Denmark moved simultaneously on two fronts: integration policy (pushing faster employment, restricting certain benefits, creating job-first pathways) and volume policy (tightening family reunification, raising attachment requirements, restricting asylum routes). Improving integration outcomes per individual was not sufficient on its own to reduce the aggregate cost at the pace Danish governments — across party lines — considered acceptable. Volume management was added as a second lever.
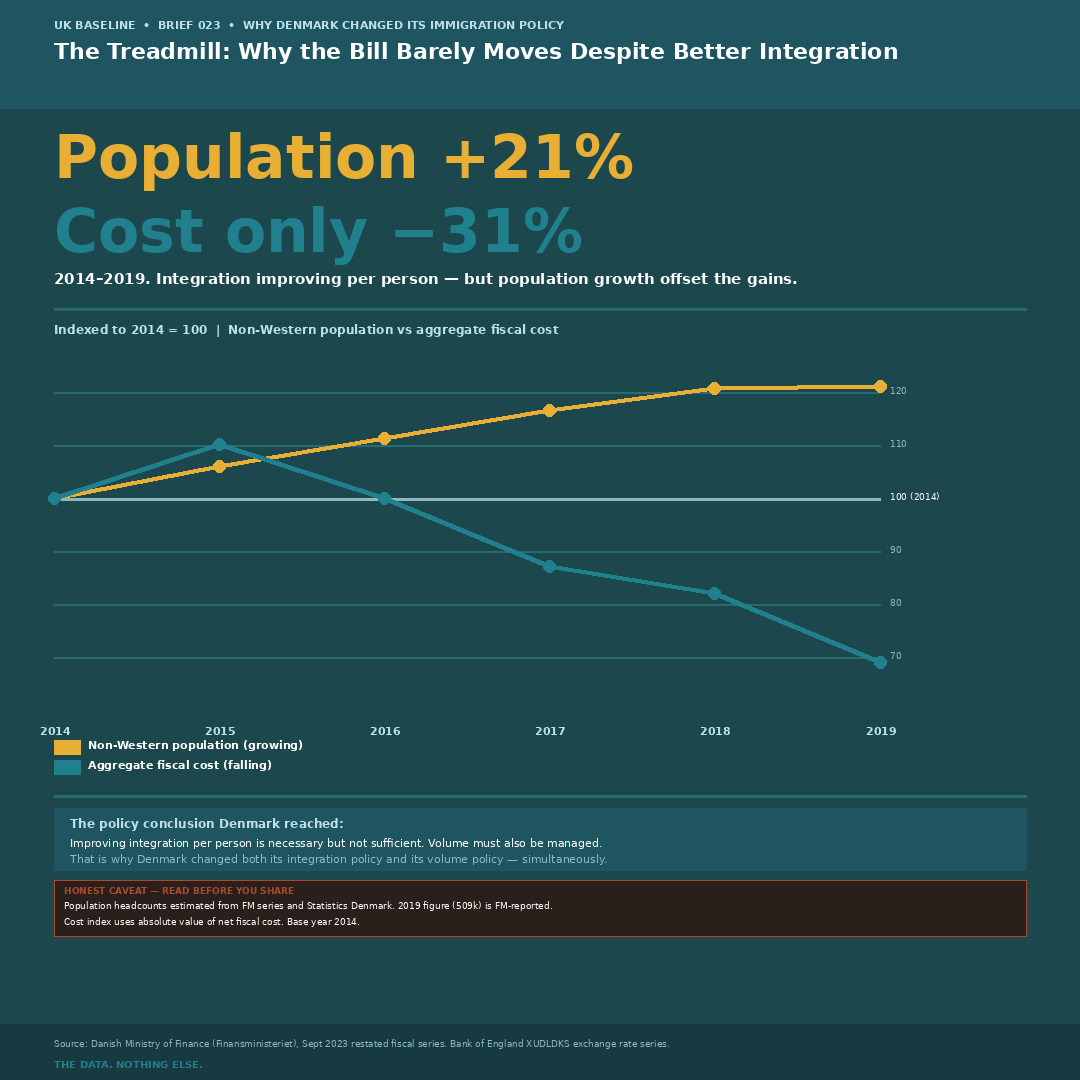
Population headcounts for 2014–2018 are estimated from FM series data and Statistics Denmark trend data. The 2019 figure (509,000) is FM-reported. The cost index uses the absolute value of net fiscal cost, rebased to 2014=100.
Not Right-Wing Politics
The most significant aspect of Denmark's immigration policy for a UK audience is not the data itself — it is who acted on it. The Støjberg reforms of 2015–2019 were introduced under a centre-right government and drew international criticism. But the Social Democrats — Denmark's equivalent of the UK Labour Party — won the 2019 election on an explicitly strict immigration platform, maintained every major tightening, and introduced 29 further measures of their own.
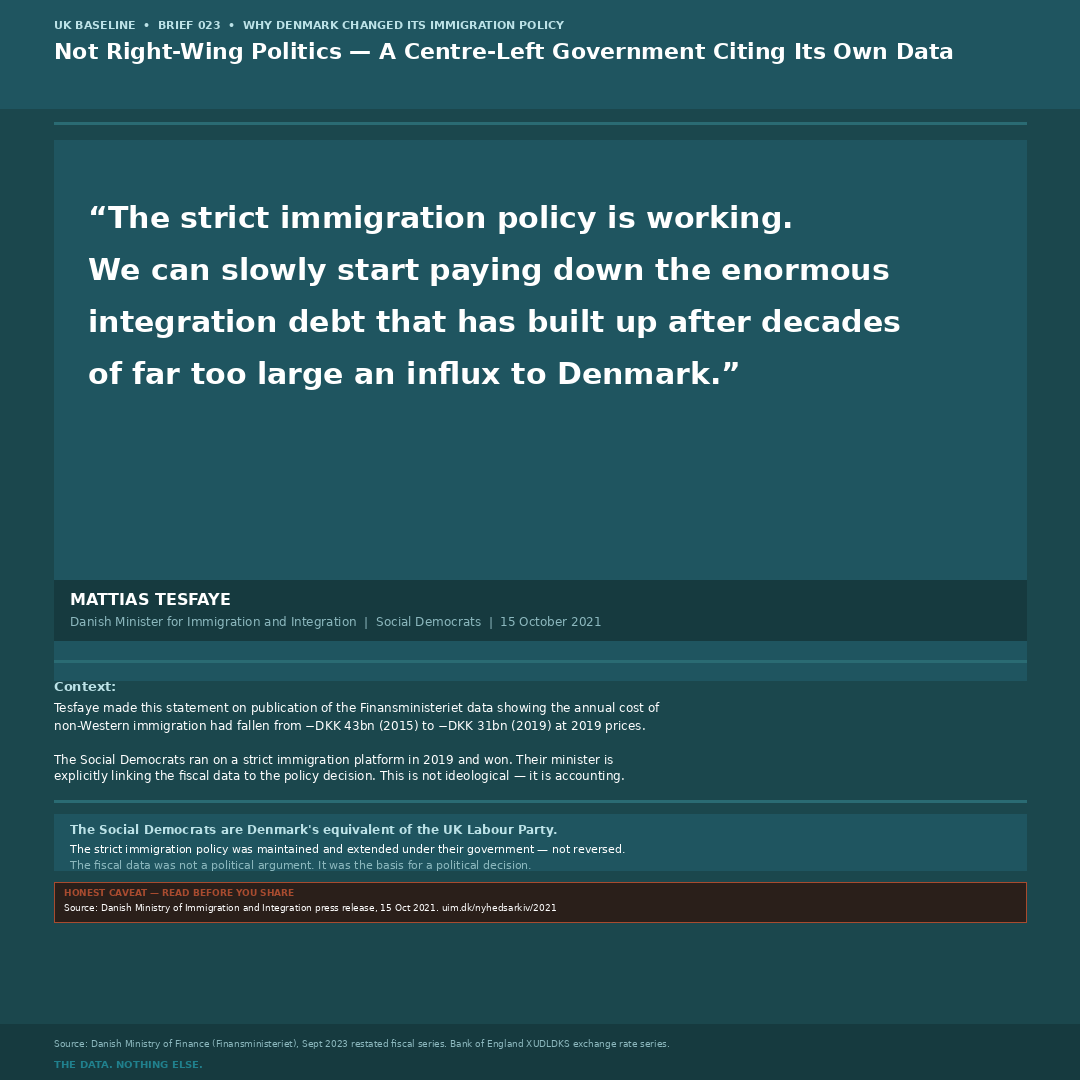
In October 2021, Denmark's Social Democrat Minister for Immigration and Integration, Mattias Tesfaye, addressed the publication of the Finansministeriet data showing the annual cost had fallen from −DKK 43bn (2015) to −DKK 31bn (2019).
"The strict immigration policy is working. We can slowly start paying down the enormous integration debt that has built up after decades of far too large an influx to Denmark."
Mattias Tesfaye, Danish Minister for Immigration and Integration (Social Democrats) — 15 October 2021
Source: uim.dk, October 2021
This is not a minister defending ideology. It is a minister citing a falling number as proof of policy effectiveness — and explicitly framing the prior period as an accumulation of "integration debt." The logic is the same logic the Finansministeriet data supports: the cost was real, the trend is improving, and the policy is the mechanism.
The Policy Timeline
Denmark's immigration tightening is not a recent event. It has been a continuous, cross-party process running for over two decades. The key legislative moments:
The Broader Context: GDP Per Capita
Denmark's GDP per capita has been consistently 25–33% above the UK's throughout 2000–2024, and the gap has widened since the pandemic. On World Bank constant-price data, Denmark's per-capita output was $49,267 in 2000 versus the UK's $39,297 — a 25% gap. By 2024 that had widened to $60,773 versus $47,901 — a 27% gap.
It would be tempting to attribute this divergence to immigration policy. The data does not support that as a primary explanation. Denmark's productivity advantage is long-standing and predates the 2002 immigration tightening. The academic literature — including a 2026 ECB Forum paper covering 38 OECD countries — identifies skill composition of immigration, not volume, as the variable associated with productivity outcomes. High-skilled immigration shows a measurable positive association with TFP growth; low-skilled immigration shows a statistically null, not negative, effect. The mainstream explanations for the Denmark-UK gap are capital investment, R&D intensity, sectoral structure (particularly Denmark's pharmaceutical sector), and labour-market institutions.
What the productivity data does show is that the UK's real GDP per capita flatlined from 2022 to 2024 — a period of record net migration — not because immigration is necessarily the cause, but because population grew faster than output. ONS's own analysis notes that real GDP per head in Q2 2024 was still below its pre-pandemic level, despite total GDP being 2.9% higher. That is an arithmetic consequence of population growth outpacing employment and hours worked. Denmark's per-capita figure kept rising over the same period.
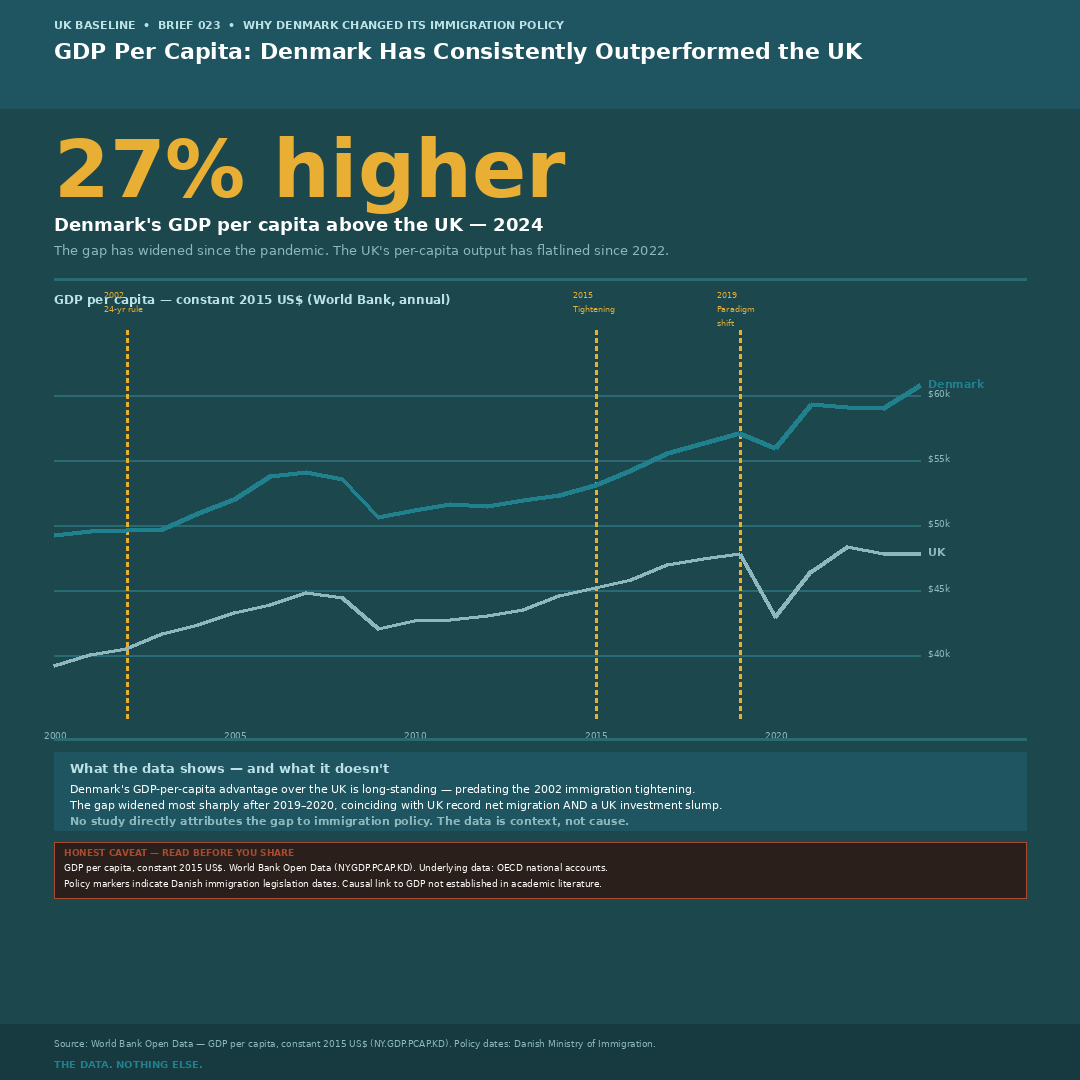
GDP per capita figures: World Bank Open Data, constant 2015 US$ (NY.GDP.PCAP.KD). Policy markers indicate Danish immigration legislation dates. No academic study directly attributes the Denmark–UK productivity or per-capita GDP gap to differences in immigration policy. Other explanations — capital investment, R&D, sectoral structure, flexicurity — are better evidenced in the academic literature.
What the UK Data Shows — and Doesn't
The central question raised by Denmark's experience is straightforward: what would the equivalent UK figures show? The answer is that no equivalent UK figure exists. No UK government body publishes an annual net fiscal cost of immigration broken down by origin in this way. Denmark has been producing this data since 2001. The UK has not.
The Migration Advisory Committee and academic researchers have produced estimates of net fiscal contributions by immigration category. The MAC's 2025 lifetime fiscal values show substantial variation by route: a skilled worker (non-Health and Care) contributes an estimated +£689,000 over a lifetime; a Health and Care care worker contributes −£36,000; a partner or family visa holder, −£109,000. These are lifetime figures, not annual, and they are route-level averages concealing wide individual variation. They are also point-in-time estimates rather than a rolling annual series comparable to Denmark's.
The absence of a Danish-equivalent UK dataset is itself a data point. A government that does not measure a cost cannot demonstrate that it is falling, cannot cite falling figures to justify policy, and cannot build the kind of cross-party evidence base that Denmark has accumulated over 25 years. Whether the UK should produce such data, and what it might show, is a question the data cannot answer. That it does not exist is a fact.