What Happens to Every Extra £1 You Earn
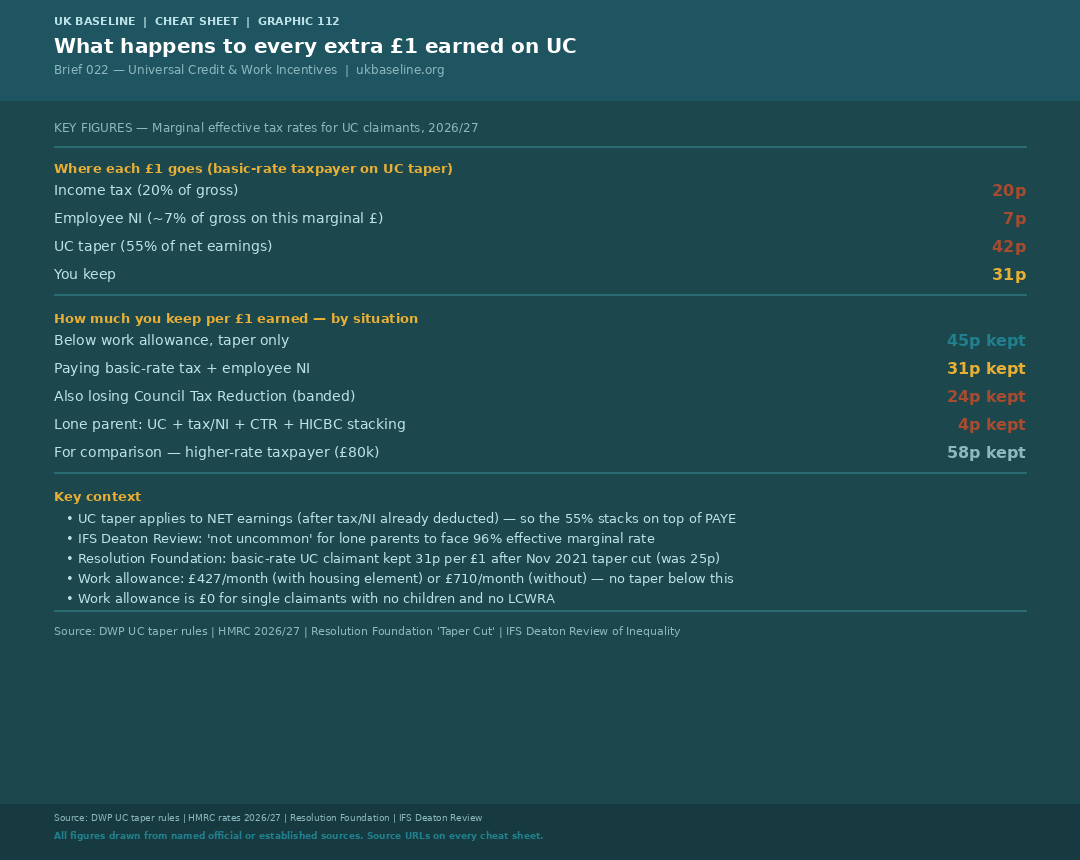
Universal Credit uses a taper mechanism: for every pound of net earnings above a claimant's work allowance, their UC payment is reduced by 55p. That means they keep 45p per additional pound — before income tax and National Insurance are considered. For a claimant whose earnings are also above the income tax and employee NI thresholds, the combined effect is more severe: income tax takes 20p from each gross pound, employee NI takes around 7p, and the UC taper then takes 55% of what remains. The result is that a basic-rate taxpaying UC claimant keeps approximately 31p of each additional pound earned — less than a higher-rate taxpayer earning £80,000, who keeps 58p (paying 40% tax and 2% NI).
The 31p figure is not the floor. Council Tax Reduction — a means-tested discount on council tax — is withdrawn separately and simultaneously with the UC taper in most English councils. In Manchester's scheme, CTR disappears in bands as earnings rise, with the transition from full support (85% of liability) to zero support occurring across just five income bands of £25 per week each. Once CTR withdrawal is stacked on top of the UC taper and PAYE, a claimant can keep as little as 24p per additional pound. For lone parents where the High Income Child Benefit Charge also interacts, the IFS Deaton Review of Inequality identifies effective marginal rates of up to 96% — meaning some claimants keep just 4p in the pound on additional earnings.
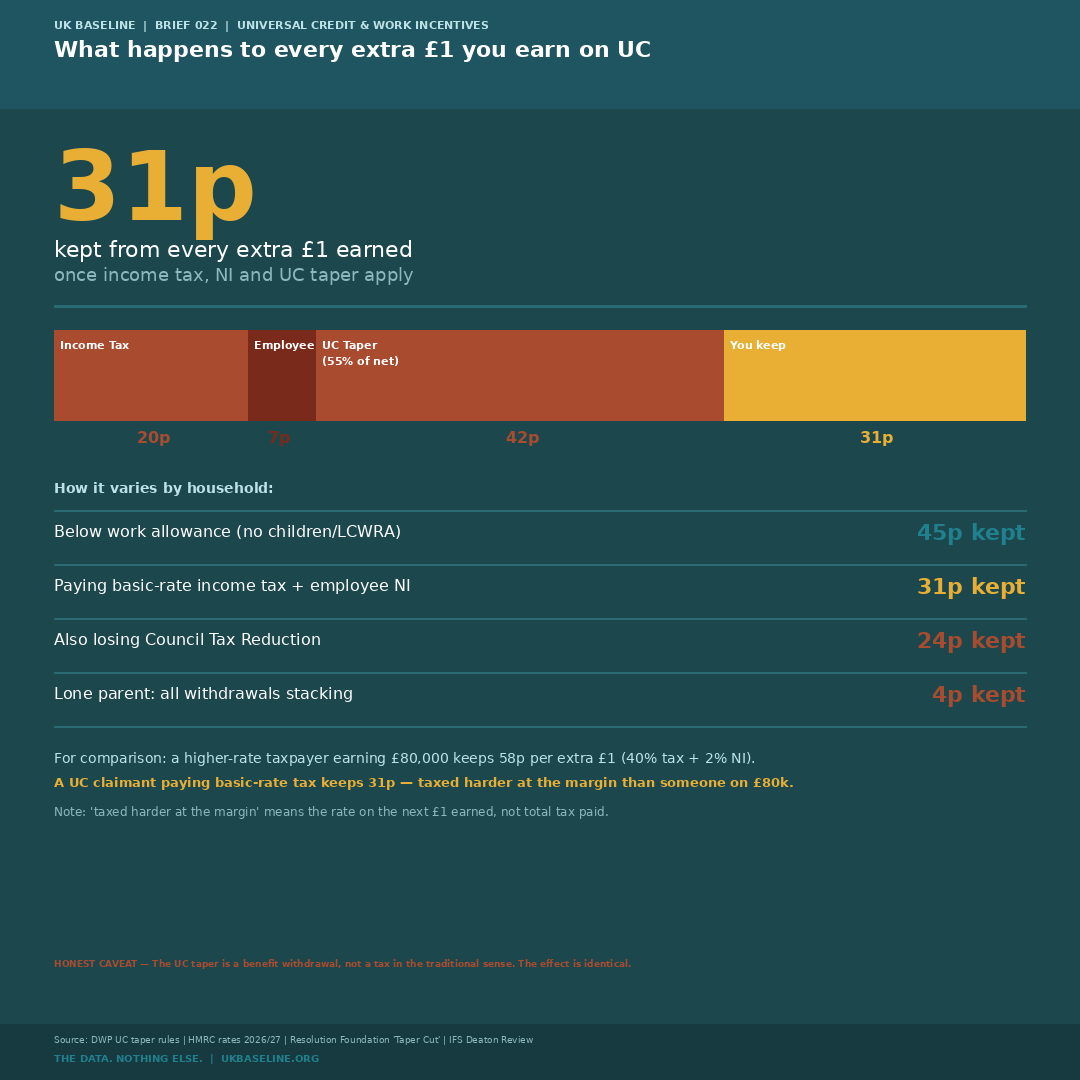
The UC taper is a benefit withdrawal, not a tax in the traditional sense — the underlying mechanism is different even if the financial effect is identical. The 31p figure applies to a basic-rate taxpayer above the work allowance; those below the work allowance keep 45p per pound on the taper only. The 4p figure is the extreme end — a lone parent with all withdrawals interacting simultaneously — not a typical case. Work allowance: £427/month (with housing element) or £710/month (without); £0 for single claimants with no children and no limited capability for work.
What You Actually Take Home: The Full Disposable Income Picture
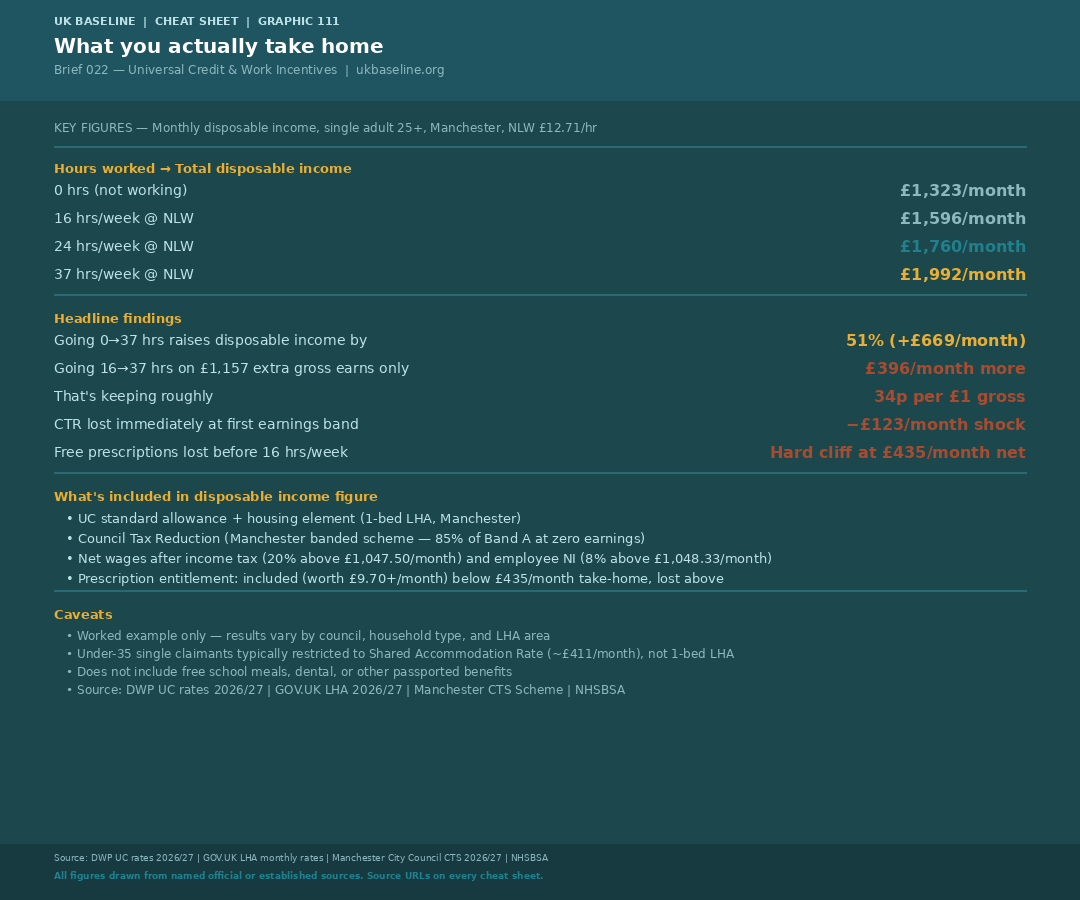
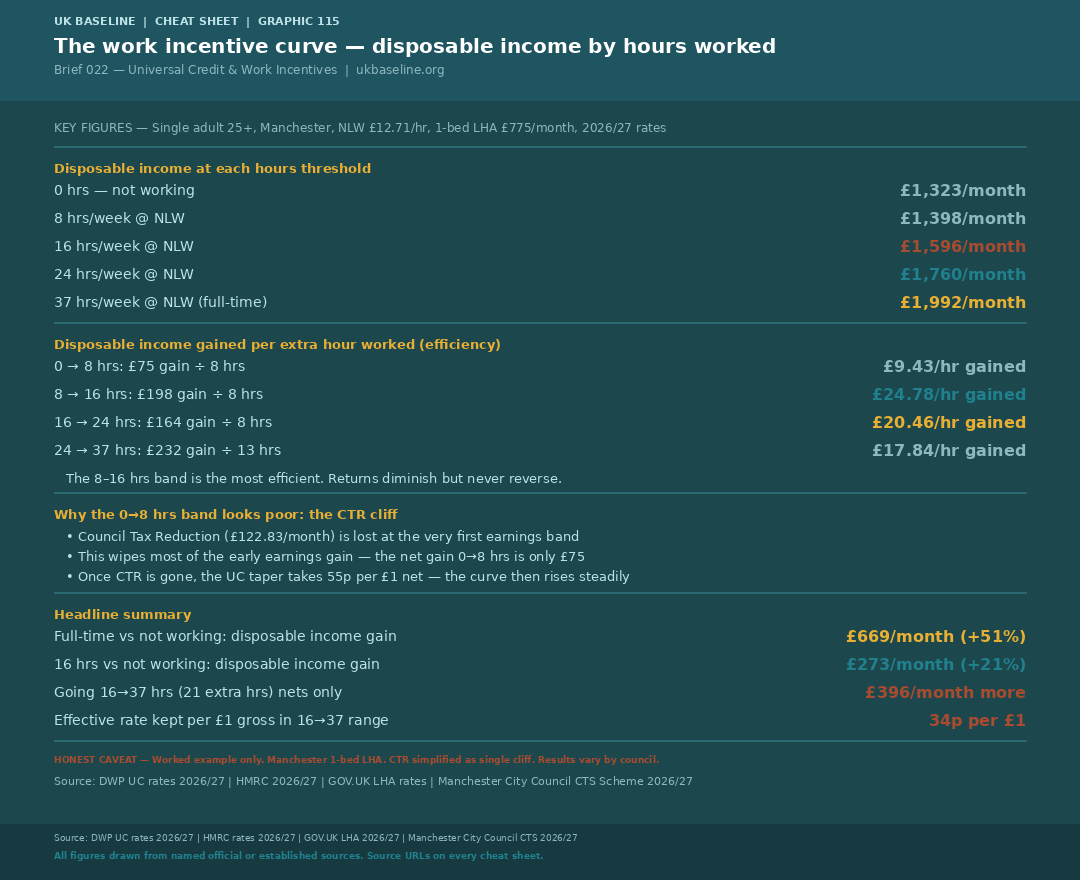
In cash terms, going from not working to full-time (37 hours per week at the National Living Wage of £12.71/hour) raises total disposable income by £669 per month — from £1,323 to £1,992, a 51% increase. This worked example covers a single adult aged 25 or over, renting in Manchester at the one-bedroom Local Housing Allowance rate, on 2026/27 benefit and tax rates. The £1,323 figure at zero hours includes the UC standard allowance (£424.90), the one-bedroom LHA housing element (£775.00), and Council Tax Reduction under Manchester's scheme (£122.83).
The common claim that going to work is "only £200 better off" typically refers to moving from part-time (around 16 hours) to full-time, not from not working at all. That figure has more arithmetic behind it than it first appears: going from 16 to 37 hours — more than doubling hours worked — generates £1,157 of additional gross earnings but nets only £396 of additional disposable income. That is 34p kept for each extra pound of gross earnings across that range, a real constraint that the data confirms. The frustration expressed by claimants is arithmetically grounded. But £396 per month extra is still significant in absolute terms for someone whose starting disposable income was £1,596.
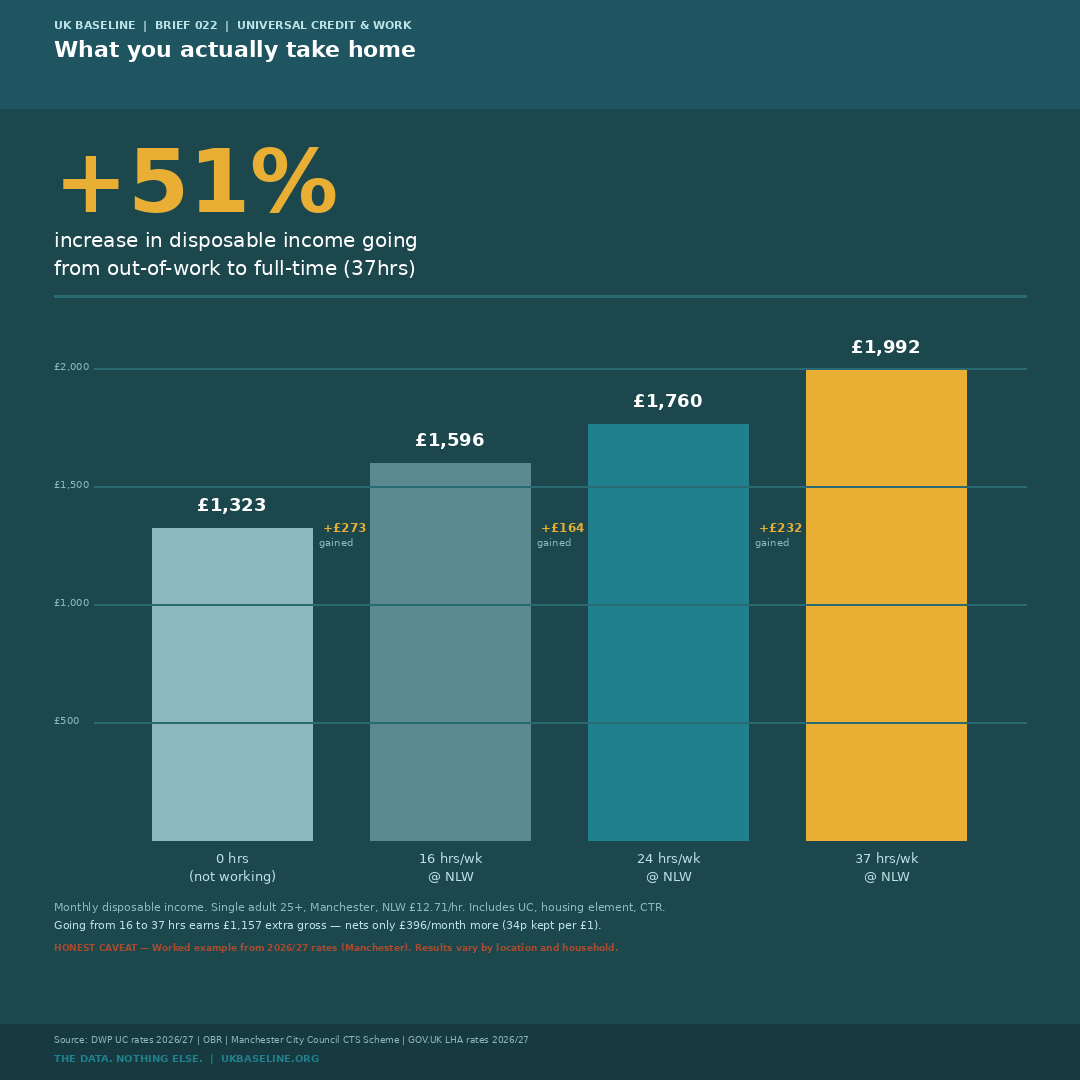
This is a worked example constructed from 2026/27 DWP, HMRC and local authority rate sources — it is not a quoted third-party model. Results vary significantly by council (CTR design differs), by LHA area (housing element rates differ), and by household type. Single adults under 35 without a disability or children are typically restricted to the Shared Accommodation Rate (£411.58/month in Manchester), which materially reduces the zero-hours starting income. The worked example does not include free school meals, NHS dental or other passported benefits.
The Work Incentive Curve: Why 16 Hours Feels Rational
Plotting disposable income against every hour worked from zero to 37 reveals why 16 hours has become a culturally embedded stopping point — even though the 16-hour rule that once applied under legacy benefits was abolished when Universal Credit was introduced. The curve rises steeply from zero in the first few hours, then immediately loses £122.83 when the Council Tax Reduction cliff edge hits at the first earnings band. It then rises steadily but at a reduced rate through 8, 16, 24 and 37 hours.
Breaking the curve into segments by disposable income gained per extra hour worked: the 0–8 hour segment yields only £9.43 per extra hour (the CTR cliff absorbs most of the early gain); the 8–16 hour segment yields £24.78 per extra hour (the most efficient segment); the 16–24 hour segment yields £20.46; and the 24–37 hour segment yields £17.84. The returns are consistently positive — every extra hour worked raises disposable income — but diminish progressively as the taper and tax take absorb more of each pound earned. There is no rational peak at 16 hours; stopping there simply reflects where people can observe the curve flattening relative to the effort involved.
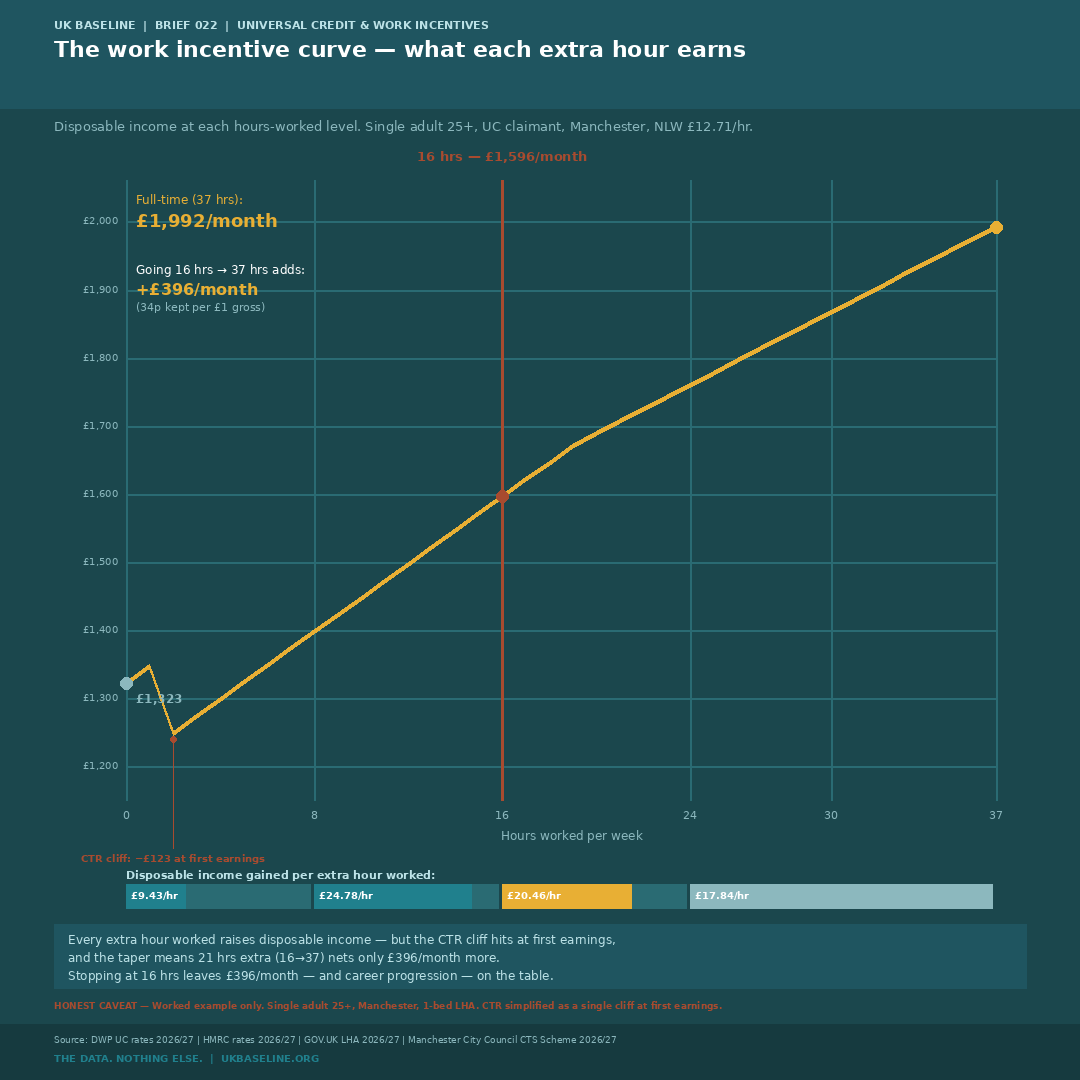
The CTR cliff in this model is simplified as a single drop at first earnings. In reality, Manchester's CTR scheme uses six discrete income bands — the cliff is stepped rather than vertical, but the effect is concentrated at the low-earnings end. The curve is calculated for a specific household profile; a claimant with children or a work allowance would see a different (generally flatter early section, then similar taper gradient).
The Hidden Cliff Edges
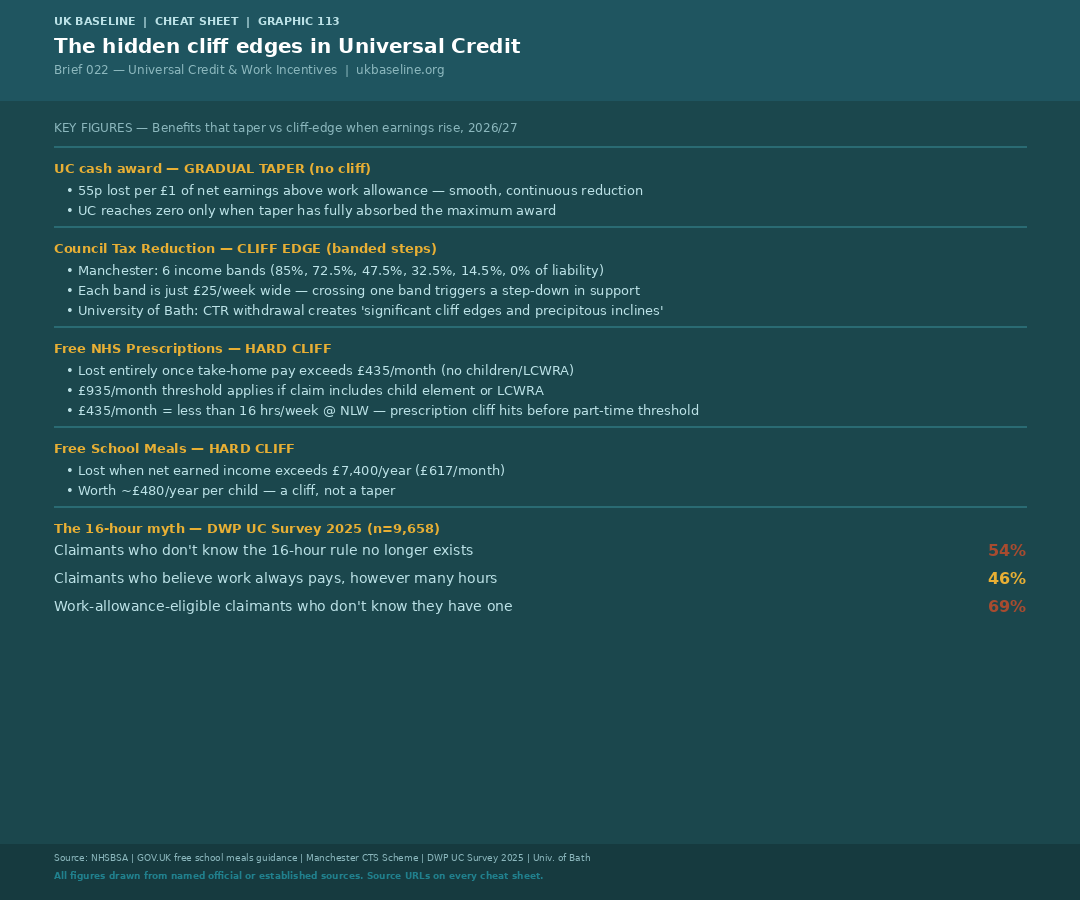
Beyond the UC taper, several benefits disappear entirely when earnings cross a threshold — creating sudden drops in support that the taper itself does not replicate. Free NHS prescriptions are lost once take-home pay exceeds £435 per month for a claimant without a child element or limited capability for work. At the National Living Wage, that threshold is crossed before 16 hours per week — meaning a claimant taking on even modest part-time work can lose prescription entitlement in their first assessment period of employment. A prescription pre-payment certificate costs £116.30 per year; individual items cost £9.90 each. For claimants with regular prescription needs, this is a material financial penalty for starting work.
Free school meals disappear when net earned income exceeds £7,400 per year (£617 per month), worth approximately £480 per year per child. Council Tax Reduction, as noted above, is structured as a series of bands rather than a true taper in most English councils — each band crossing produces a step-down in support that is indistinguishable in effect from a cliff edge. These benefits are not included in the UC taper calculation and are not offset by any compensating payment when earnings rise. They represent hidden costs of starting or increasing work that sit entirely outside the headline taper rate discussion.

Council Tax Reduction scheme design varies by local authority — Manchester is used as a representative northern English example. The prescription threshold of £435/month take-home pay applies to single claimants without a child element or LCWRA; the threshold rises to £935/month for claimants with a child element or limited capability for work. The two-child limit on the UC child element was abolished from 6 April 2026.
What Claimants Actually Believe — DWP's Own Survey
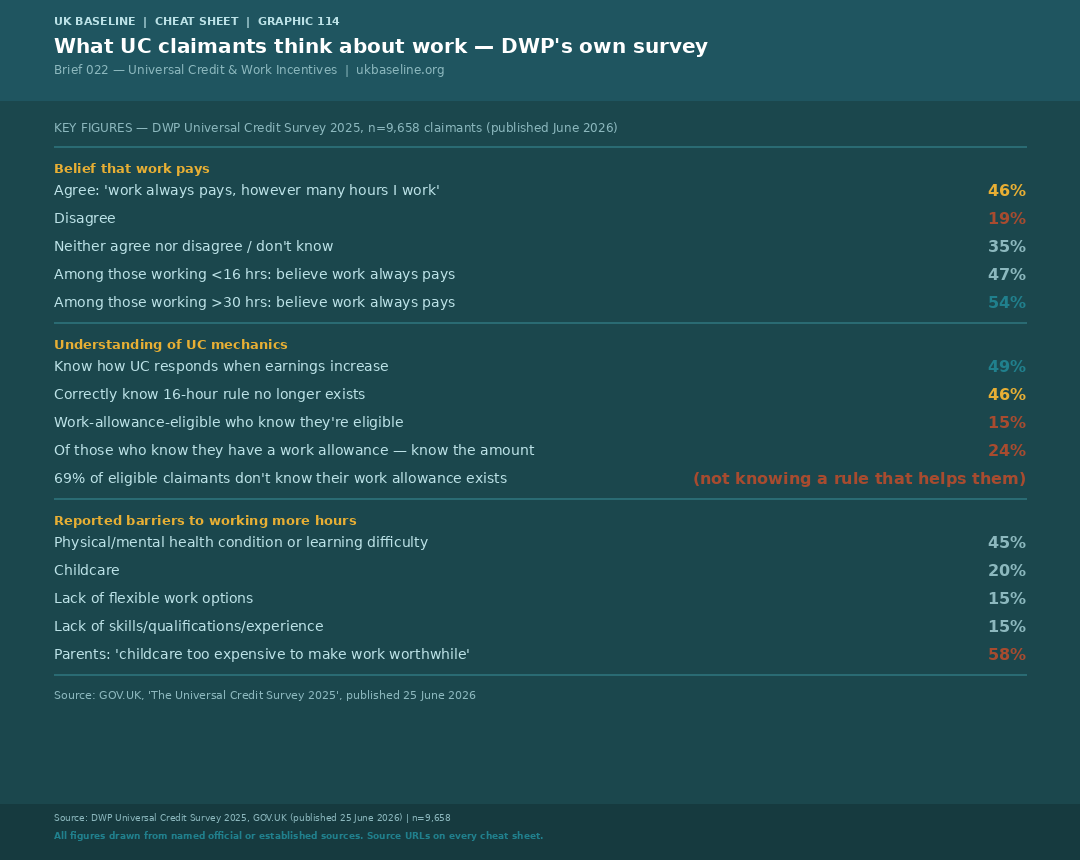
DWP published the Universal Credit Survey 2025 in June 2026 — a large-scale survey of 9,658 UC claimants examining their understanding of the system and their attitudes to work. The findings bear directly on work incentive policy: only 46% of claimants agreed that work always pays, however many hours they work. Only 49% said they knew how their UC would respond if their earnings increased. Just 46% correctly identified that the statement "you cannot work more than 16 hours per week and claim Universal Credit" is false — meaning 54% either believed the rule still exists or were unsure. The 16-hour rule was abolished when Universal Credit replaced Jobseeker's Allowance; it has not applied for years. Some claimants are restricting their hours to avoid a constraint that no longer exists.
The work allowance findings are equally stark. Among claimants who are actually eligible for a work allowance — meaning their first tranche of earnings is entirely protected from the taper — only 15% correctly knew they were eligible. Sixteen percent incorrectly believed they were not eligible, and 69% simply did not know. Of those who were aware of their eligibility, only 24% knew the cash amount of their work allowance. The system contains a rule designed to help claimants work without immediate UC reduction — and the overwhelming majority of people it applies to are unaware it exists.
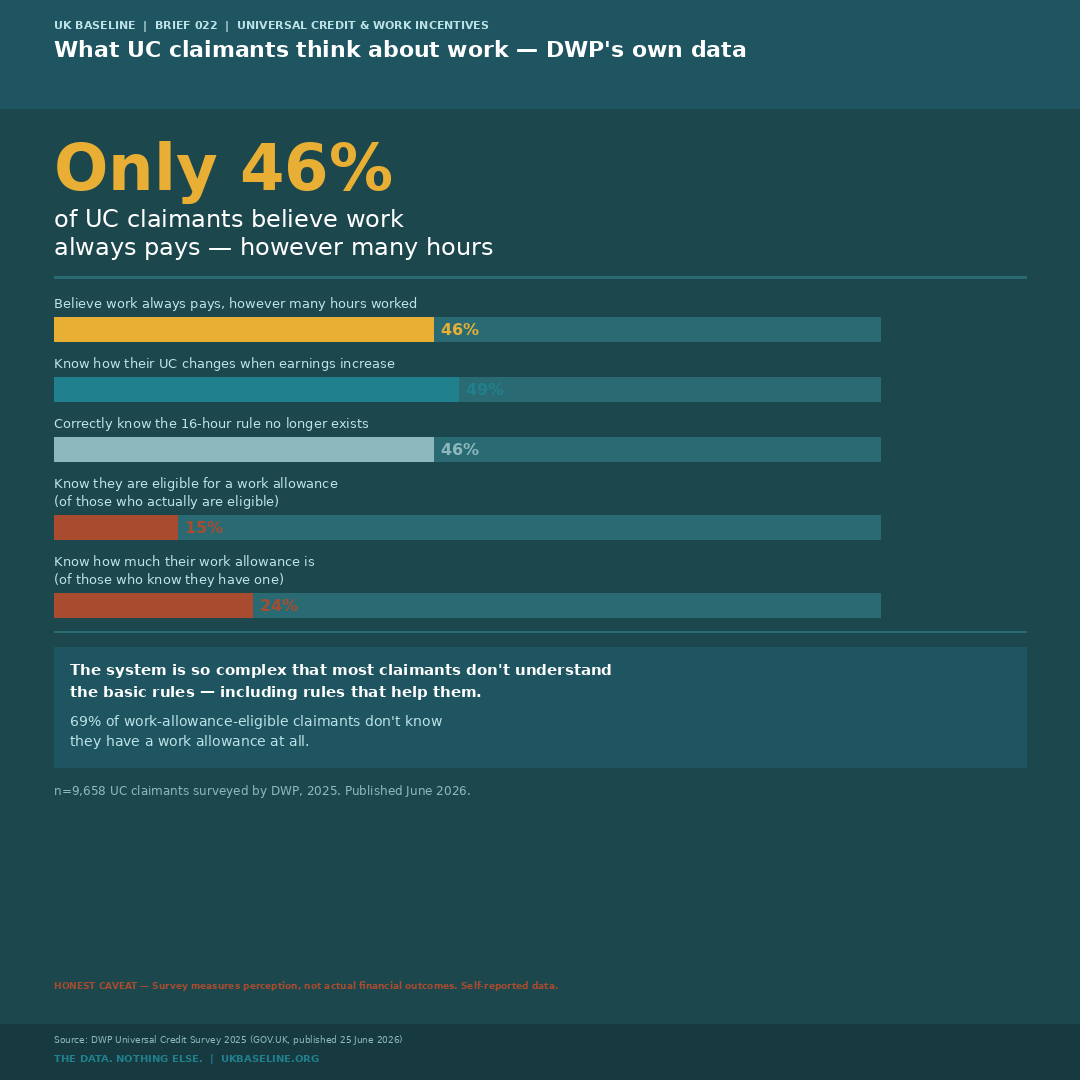
This survey measures self-reported perception, not actual financial outcomes. Low understanding of UC mechanics does not necessarily mean claimants are making economically irrational decisions — many may be responding correctly to the actual financial signals they experience, even without understanding the underlying rules. Survey base: 9,658 UC claimants, conducted by DWP 2025, published 25 June 2026.
Key Numbers
Cheat Sheets
Five cheat sheets covering the full data in this brief. Source URLs on every sheet.
Sources
- DWP — The Universal Credit Survey 2025 (GOV.UK, published 25 June 2026)
- GOV.UK — Benefit and pension rates 2026 to 2027
- GOV.UK — Universal Credit and earnings (taper, work allowance, conditionality thresholds)
- IFS — Benefits and tax credits, Deaton Review of Inequality (2026)
- Resolution Foundation — Taper cut: UC taper rate reduction analysis (November 2021)
- Resolution Foundation — In credit? UC incomes and incentives (April 2024)
- NHSBSA — Universal Credit and NHS health costs: prescription charge exemption thresholds
- GOV.UK — Free school meals eligibility under Universal Credit (Annex B)
- Manchester City Council — Local Council Tax Support Scheme 2026/27 (PDF)
- University of Bath — Cliff edges and precipitous inclines: UC and Council Tax Reduction interaction
- GOV.UK — Local Housing Allowance monthly rates 2026 to 2027 (England)