Net Zero
The UK has cut territorial emissions 53% since 1990. Coal is gone. Wind now generates more electricity than any other source. But transport emissions have barely moved in 34 years, consumption-based emissions tell a very different story to the official target measure, and the heat pump economics depend almost entirely on which tariff you choose. The data is more complicated than either side admits.
The Data Context
The UK’s headline net zero measure counts emissions released within its borders. That definition matters: the grid has changed dramatically, but emissions embodied in imports are not included in the statutory target; sector performance also varies sharply. The six graphics below set out the transformation of electricity, the distinction between territorial and consumption measures, the UK’s G7 position, what an electricity bill pays for, the sectors that have moved least, and the tariff-dependent economics of replacing a gas boiler with a heat pump.
Britain's Electricity Grid Has Been Transformed — Coal Is Gone
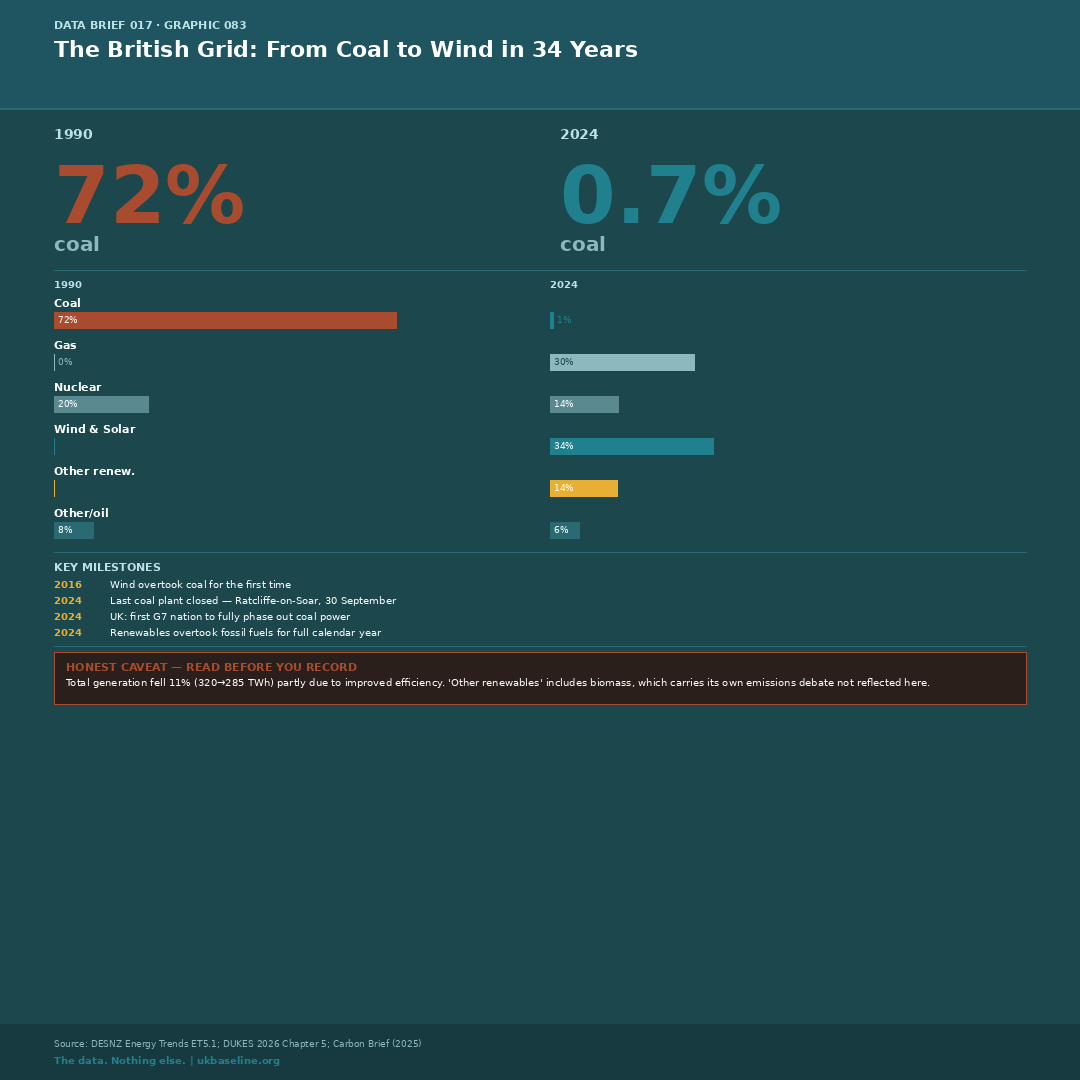
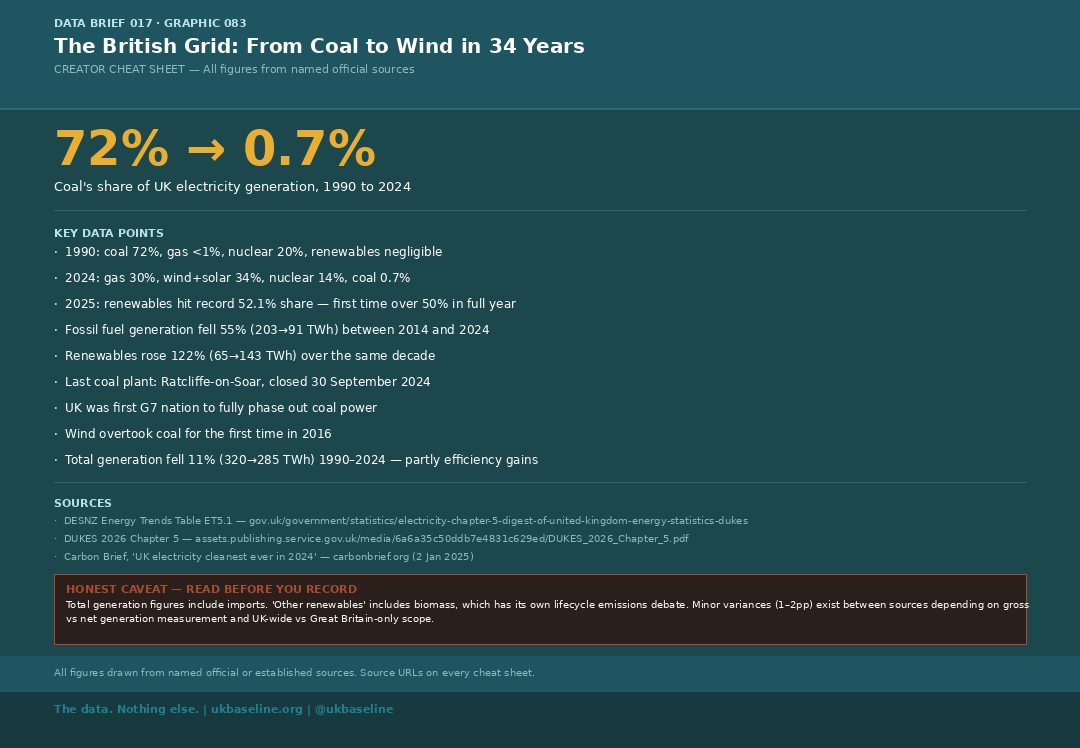
In 1990, coal generated 72% of Britain's electricity. In 2024, it generated 0.7%. On 30 September 2024, Ratcliffe-on-Soar — the last coal-fired power station in Britain — closed, making the UK the first G7 nation to fully phase out coal power. Wind and solar now account for 34% of generation; combined with nuclear and other renewables, low-carbon sources generated over 60% of electricity in 2024. In 2025, renewables hit a record 52.1% share — the first time renewables exceeded half of UK generation in a full calendar year.
- 1990: coal 72%, gas <1%, nuclear 20%, renewables negligible
- 2024: gas 30%, wind and solar 34%, nuclear 14%, coal 0.7%
- Wind overtook coal for the first time in 2016 (39 TWh vs 31 TWh)
- Fossil fuel generation fell 55% between 2014 and 2024 (203→91 TWh)
- Renewables rose 122% over the same decade (65→143 TWh)
- Total generation fell 11% (320→285 TWh) 1990–2024, partly driven by improved efficiency
- Source: DESNZ Energy Trends ET5.1; DUKES 2026 Chapter 5; Carbon Brief (Jan 2025)
The Official Climate Target Shows –53% — The Full Picture Shows –24%
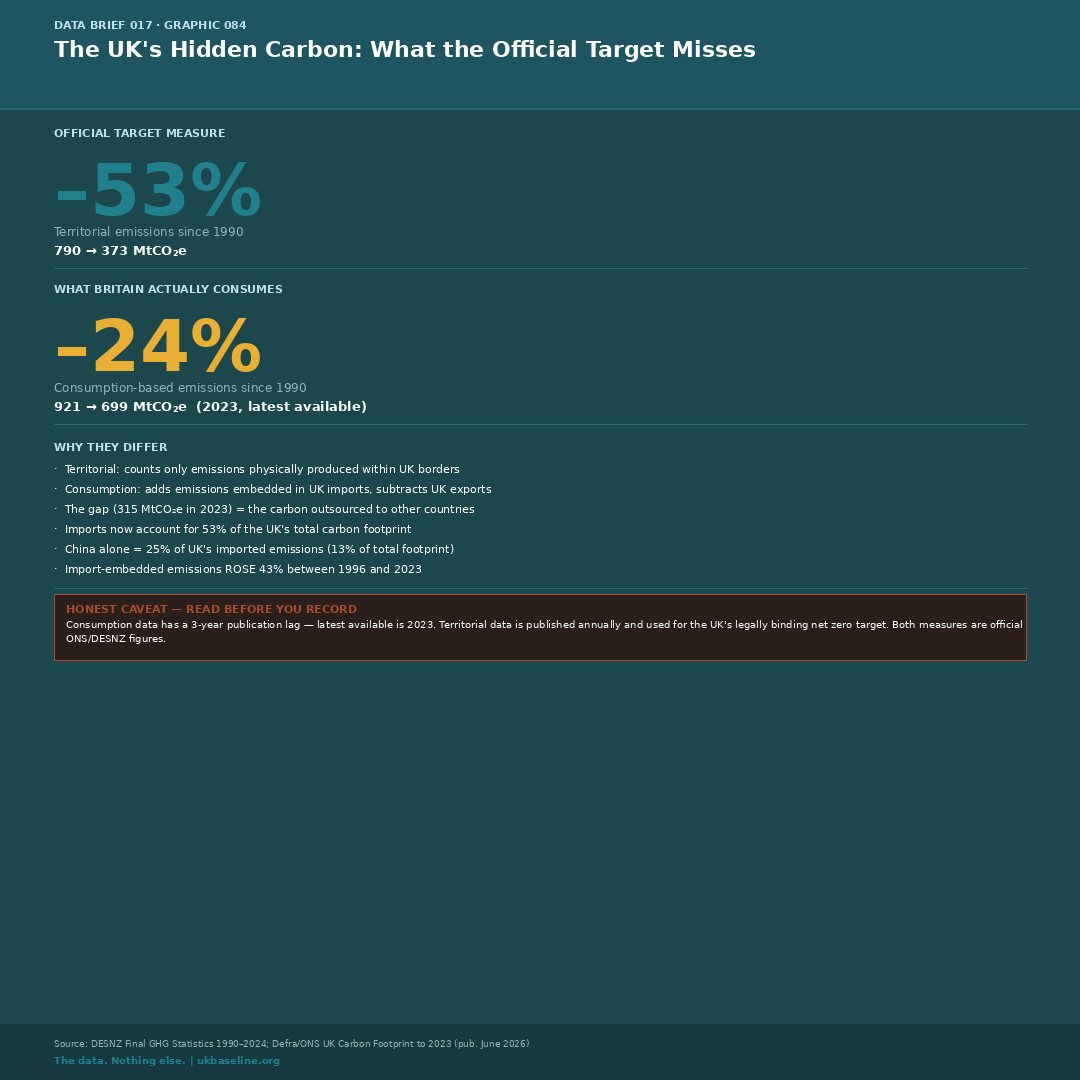
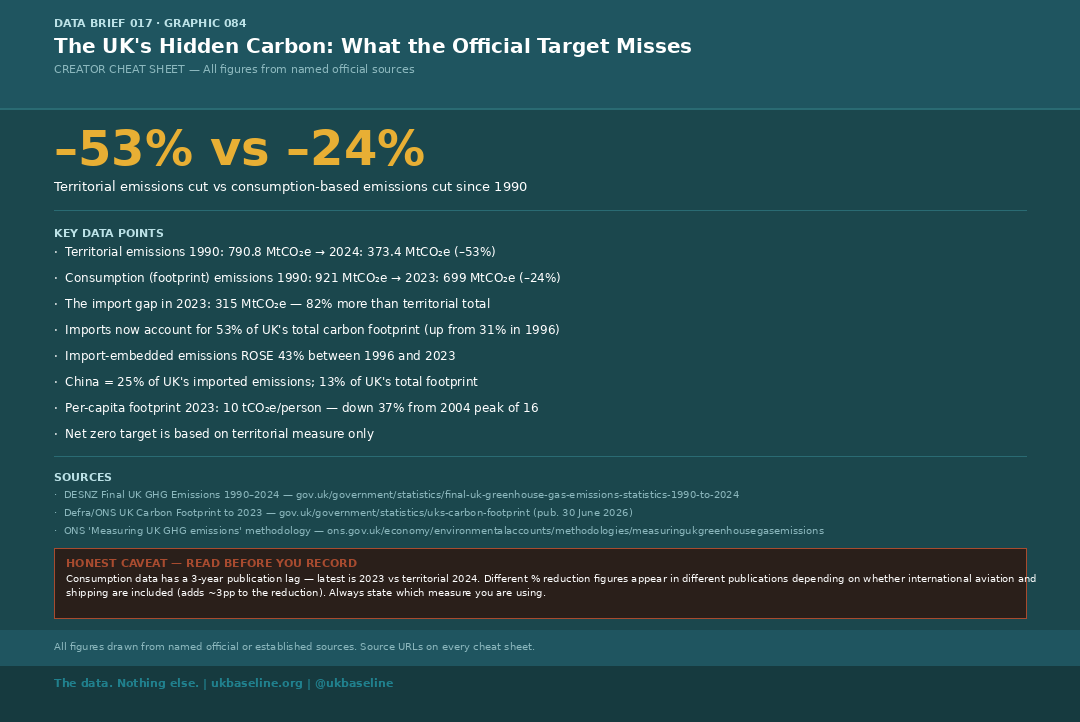
The UK's net zero target is measured against territorial emissions — greenhouse gases physically produced within UK borders. On that basis, emissions have fallen 53% since 1990, from 791 to 373 MtCO₂e. But the UK's consumption-based footprint — which adds the carbon embedded in imports and subtracts exports — has fallen only 24%, from 921 to 699 MtCO₂e (2023, latest available). The gap between the two measures was 315 MtCO₂e in 2023 — roughly equivalent to the UK's entire territorial annual emissions.
- Territorial 1990: 790.8 MtCO₂e → 2024: 373.4 MtCO₂e (–53%)
- Consumption footprint 1990: 921 MtCO₂e → 2023: 699 MtCO₂e (–24%)
- Import gap 2023: 315 MtCO₂e — the UK's outsourced carbon
- Imports now account for 53% of the UK's total carbon footprint (up from 31% in 1996)
- Import-embedded emissions rose 43% between 1996 and 2023
- China alone accounts for 25% of UK's imported emissions and 13% of total footprint
- Per-capita footprint 2023: 10 tCO₂e/person — down 37% from the 2004 peak of 16
- Source: DESNZ Final GHG Emissions 1990–2024; Defra/ONS UK Carbon Footprint to 2023 (pub. June 2026)
The UK Has Cut Emissions Further Than Any Other G7 Country Since 1990
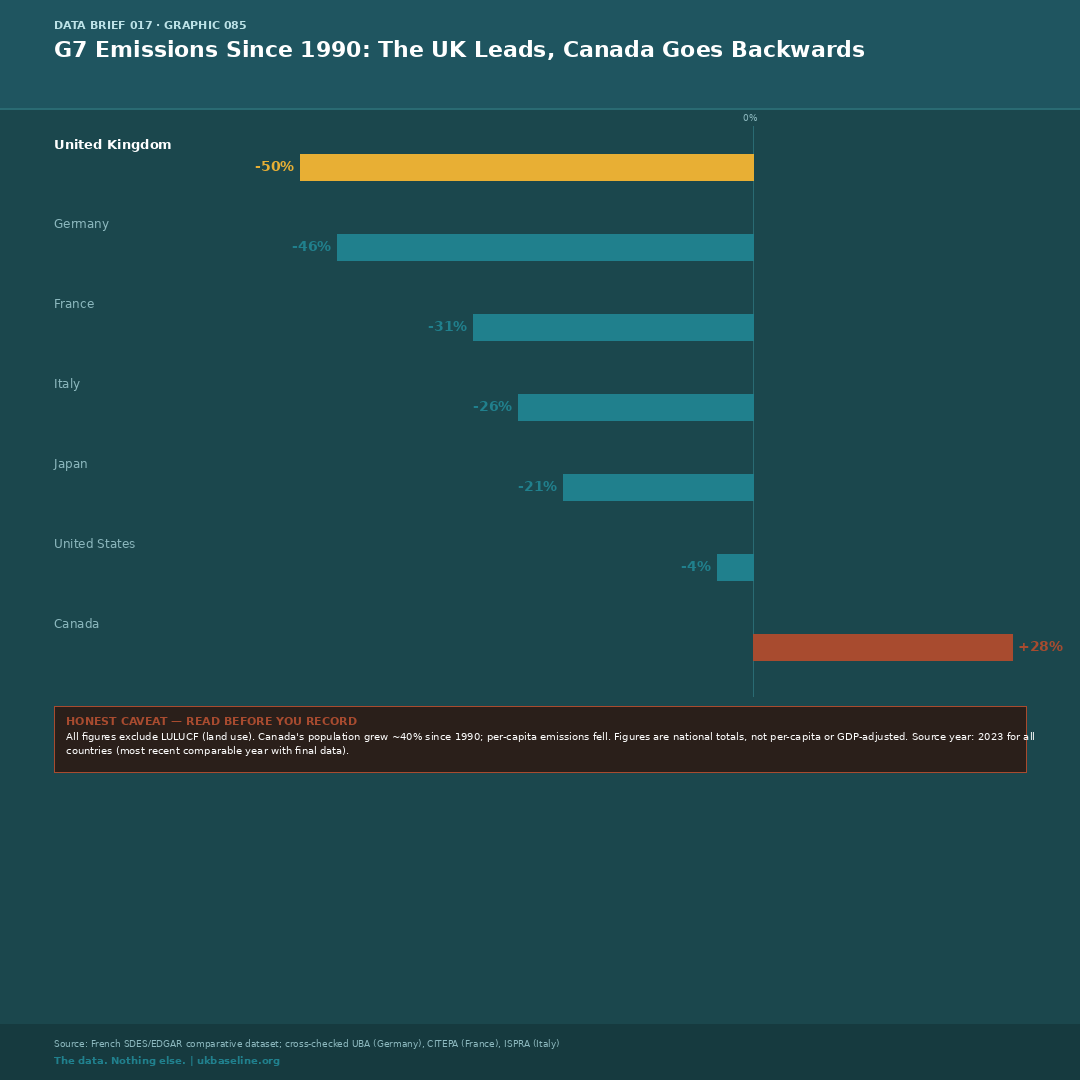
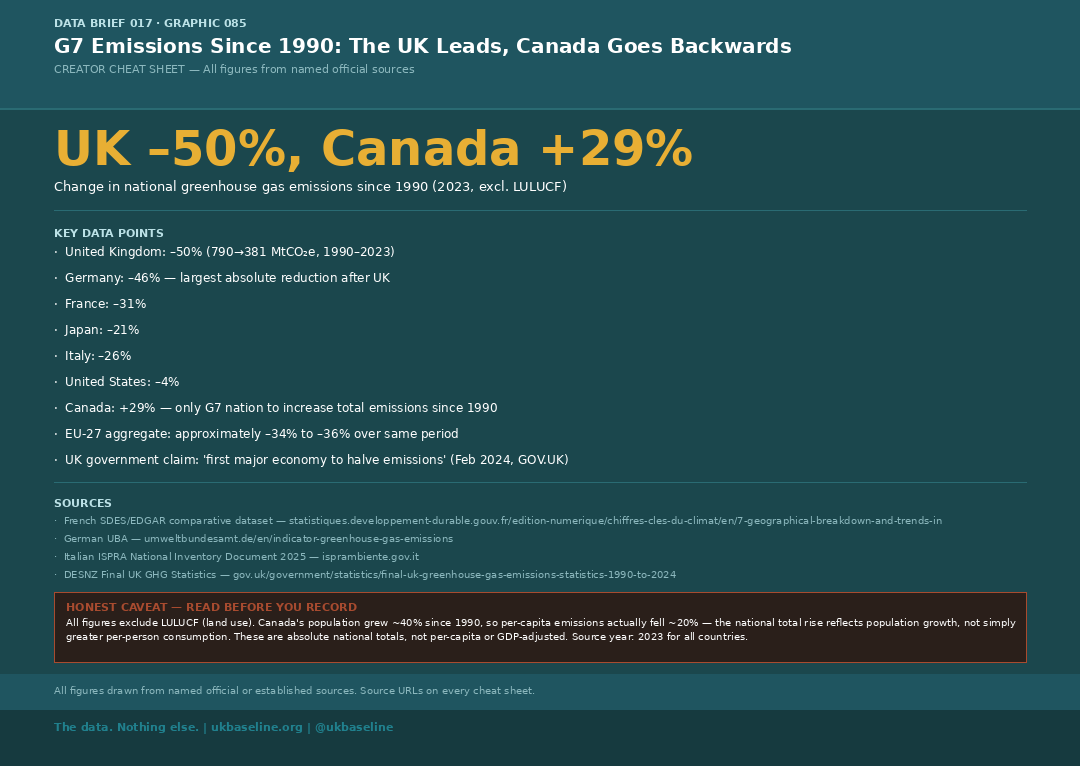
The UK reduced greenhouse gas emissions by 50% between 1990 and 2023 — more than any other G7 nation. Germany is second at –46%. Canada is the only G7 country whose emissions have risen, up 29% since 1990, though its population grew 40% over the same period meaning per-capita emissions fell around 20%. The United States has cut just 4% in 33 years.
- UK: –50% (790→381 MtCO₂e, 1990–2023)
- Germany: –46%
- France: –31%
- Italy: –26%
- Japan: –21%
- United States: –4%
- Canada: +29% — the only G7 nation to increase total emissions since 1990
- EU-27 aggregate: approximately –34% to –36% over the same period
- All figures exclude LULUCF (land use); source year 2023 for all countries
- Source: French SDES/EDGAR comparative dataset; cross-checked UBA (Germany), CITEPA (France), ISPRA (Italy)
Only 39p in Every £1 on Your Electricity Bill Is the Cost of the Actual Power
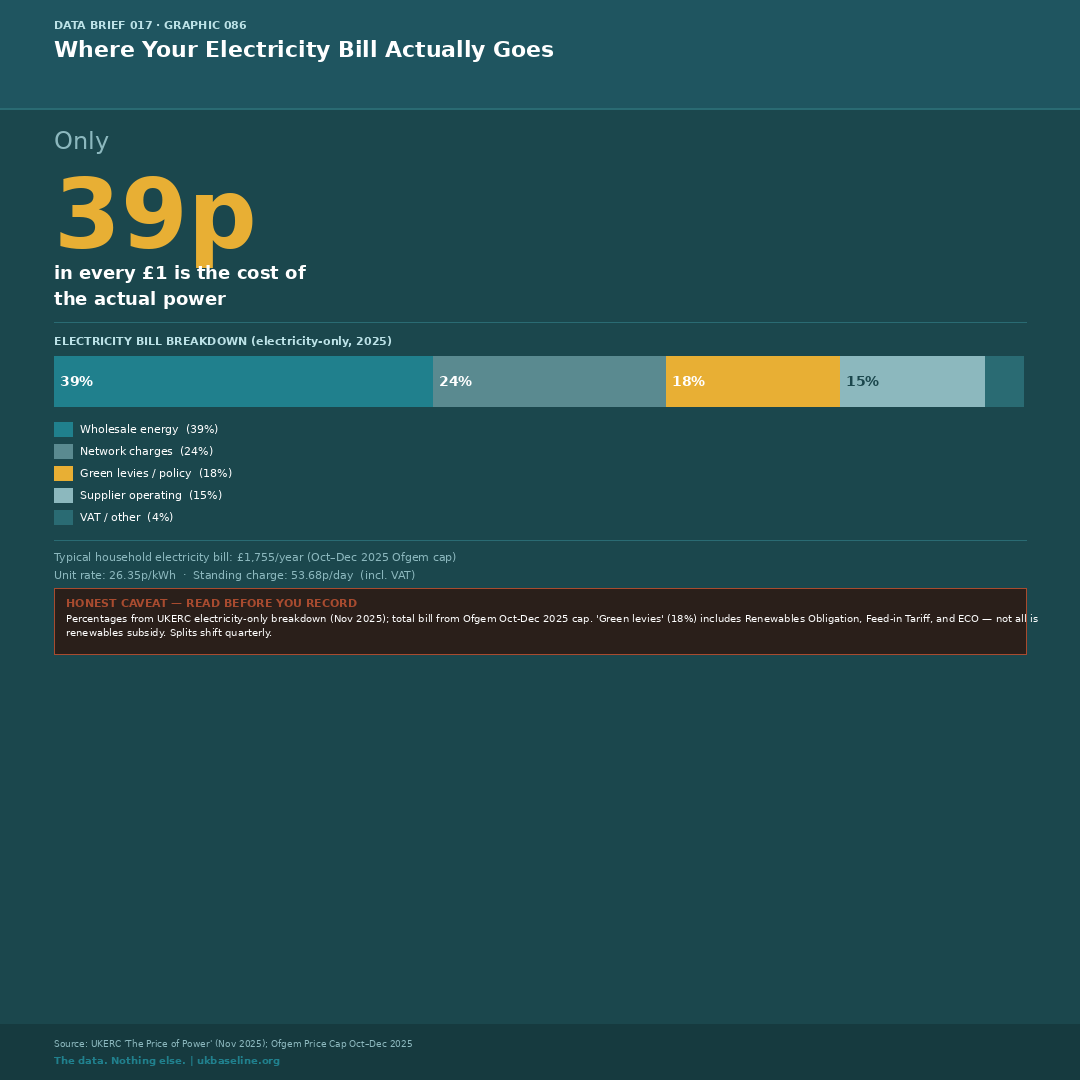
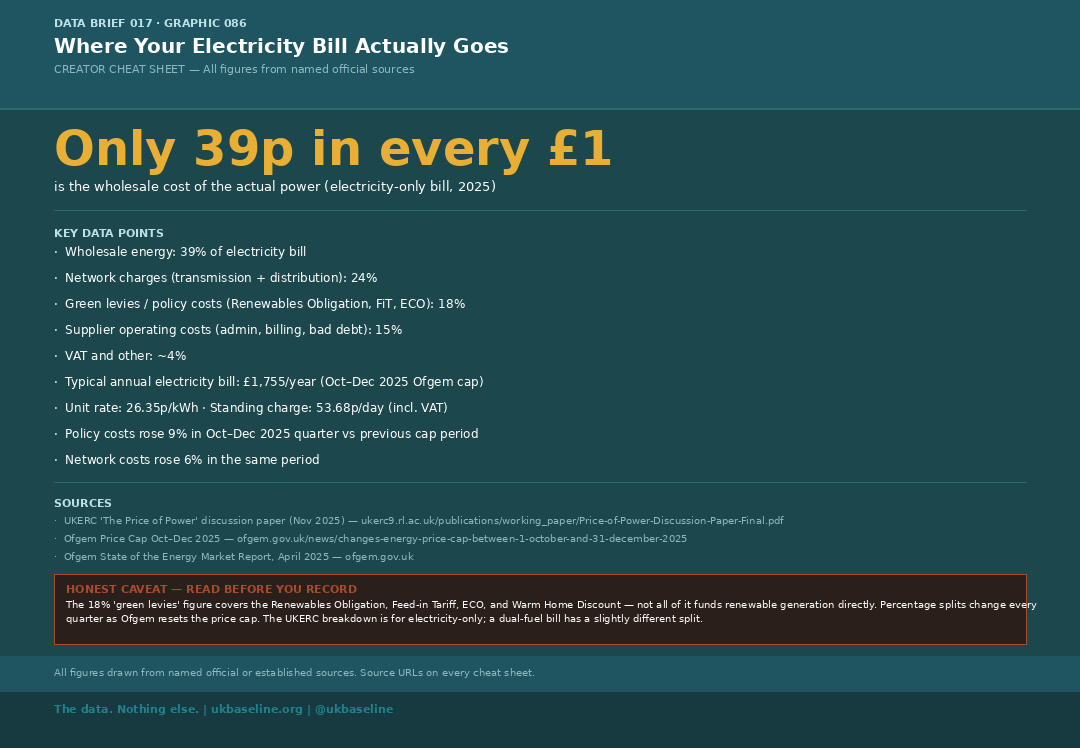
Of every pound spent on electricity, 39p goes to wholesale energy costs — the actual cost of generating the power. The remaining 61p covers network charges (24%), green levies and policy costs (18%), supplier operating costs (15%), and VAT (4%). The typical annual electricity bill under the Ofgem October–December 2025 price cap is £1,755, at a unit rate of 26.35p/kWh. Green levies — which include the Renewables Obligation, Feed-in Tariff, and ECO scheme — account for 18% of the electricity bill, not the majority that is sometimes claimed.
- Wholesale energy: 39% of electricity bill
- Network charges (transmission + distribution): 24%
- Green levies / policy costs: 18% — Renewables Obligation is the largest single item
- Supplier operating costs: 15%
- VAT and other: ~4%
- Typical annual bill: £1,755/year (Oct–Dec 2025 Ofgem cap)
- Unit rate: 26.35p/kWh · Standing charge: 53.68p/day (both incl. VAT)
- Policy costs rose 9% and network costs rose 6% in the Oct–Dec 2025 cap period
- Source: UKERC 'The Price of Power' (Nov 2025); Ofgem Price Cap Oct–Dec 2025
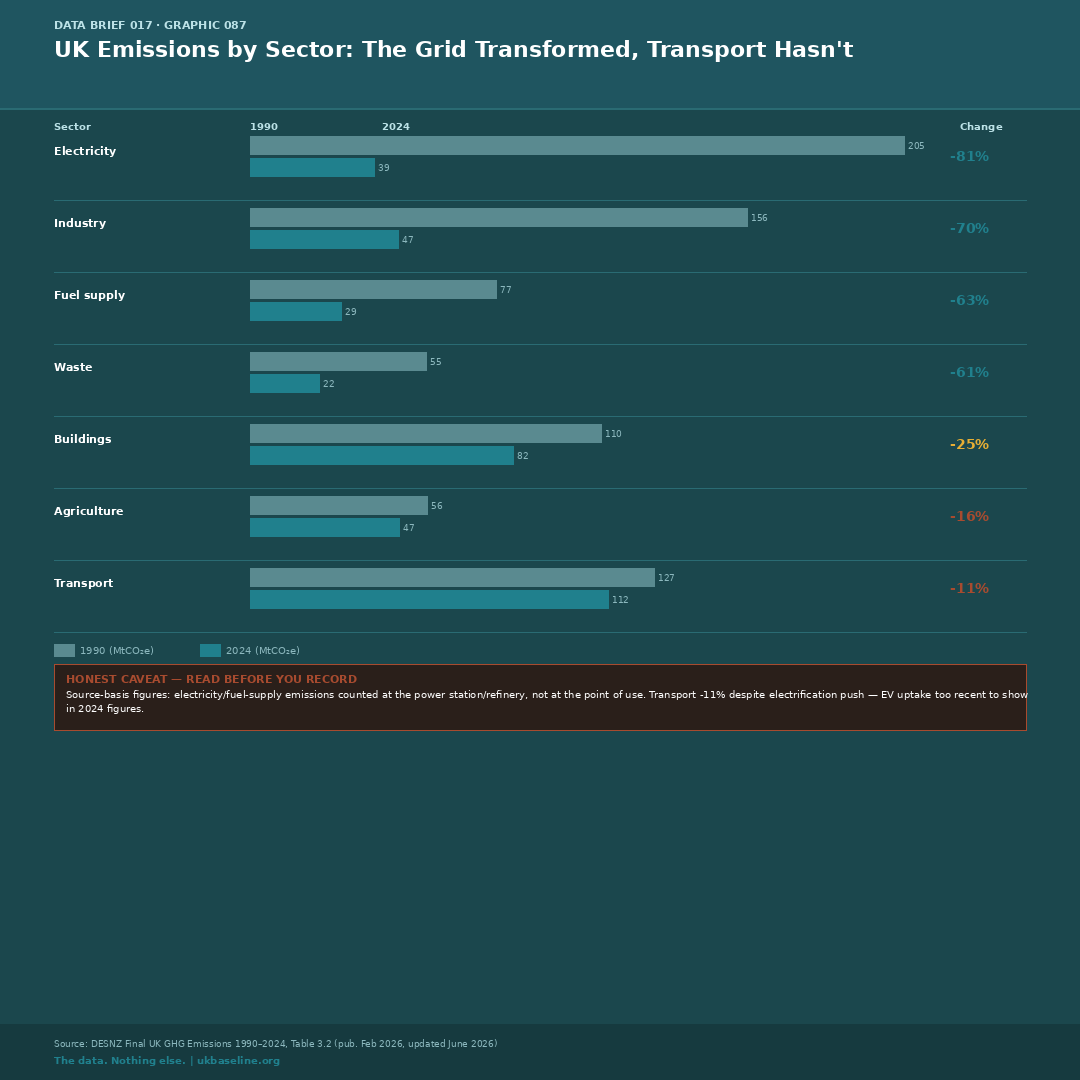
Electricity Has Decarbonised by 81% — Transport Has Barely Moved
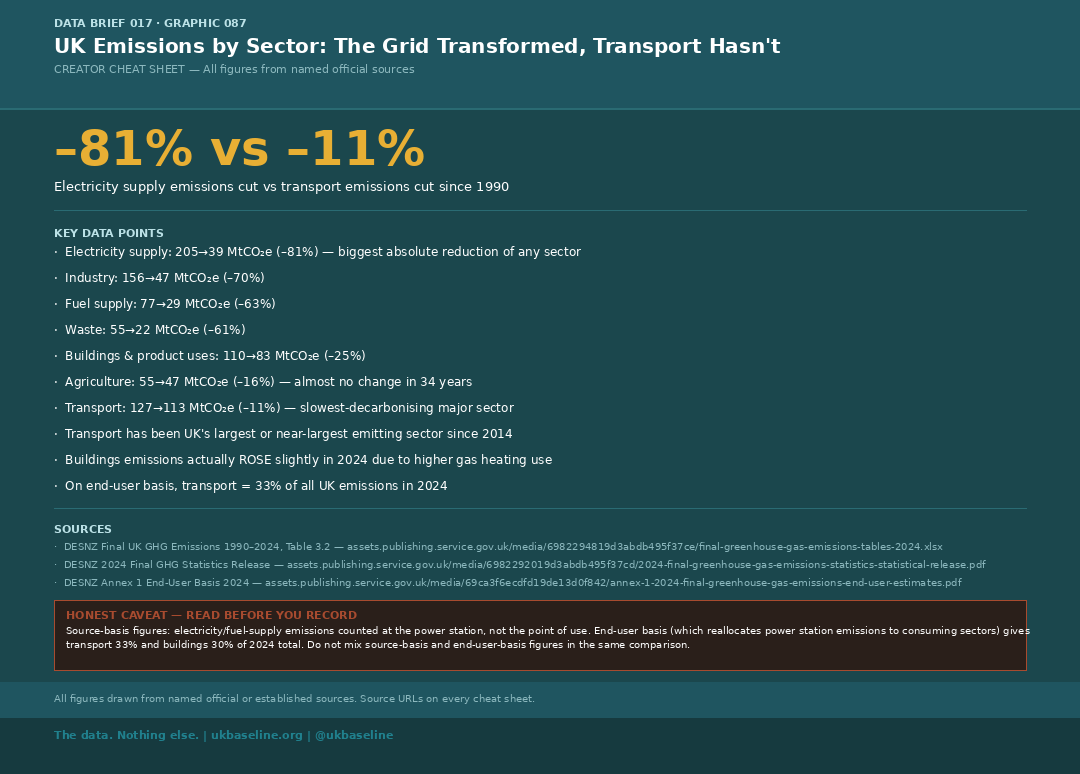
Electricity generation has delivered the single largest emissions reduction of any UK sector, falling 81% since 1990 (from 205 to 39 MtCO₂e), driven almost entirely by the coal phase-out. Industry has fallen 70%. But domestic transport — the UK's single largest emitting sector since 2014 — has fallen just 11% in 34 years (from 127 to 113 MtCO₂e). Agriculture has fallen only 16%. Buildings emissions actually rose slightly in 2024 due to higher gas consumption for heating. The EV transition is too recent to show meaningfully in 2024 sector data.
- Electricity supply: 205→39 MtCO₂e (–81%) — largest absolute reduction
- Industry: 156→47 MtCO₂e (–70%)
- Fuel supply: 77→29 MtCO₂e (–63%)
- Waste: 55→22 MtCO₂e (–61%)
- Buildings and product uses: 110→83 MtCO₂e (–25%)
- Agriculture: 55→47 MtCO₂e (–16%) — almost unchanged in 34 years
- Transport: 127→113 MtCO₂e (–11%) — slowest-decarbonising major sector
- On an end-user basis, transport = 33% and buildings = 30% of all UK emissions in 2024
- Source: DESNZ Final UK GHG Emissions 1990–2024, Table 3.2 (pub. Feb 2026, updated June 2026)
A Heat Pump Costs £5,000 Net of Grant — Whether It's Cheaper to Run Depends on Your Tariff
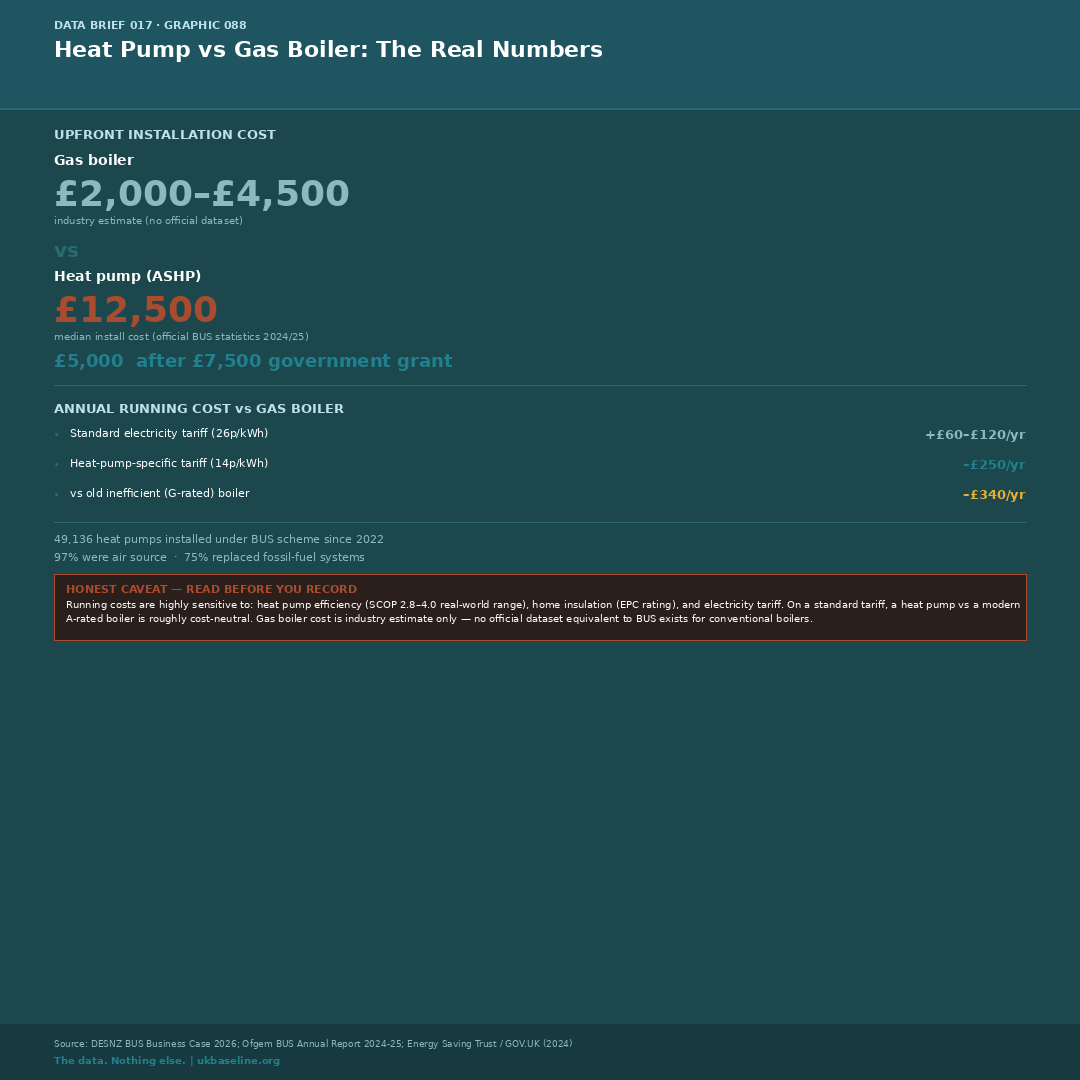
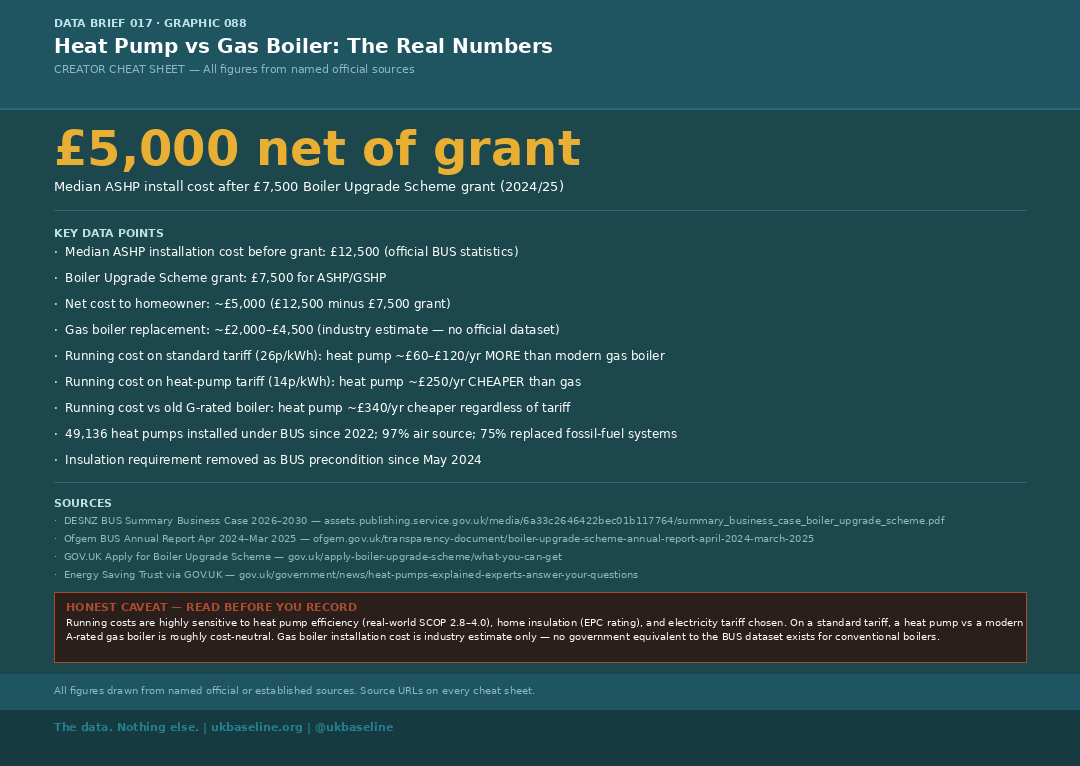
The median air source heat pump installation costs £12,500, according to official Boiler Upgrade Scheme statistics. After the current £7,500 government grant, the net cost to a homeowner is approximately £5,000 — compared to £2,000–£4,500 for a gas boiler replacement (industry estimate; no official dataset exists for boiler costs). The running cost comparison depends almost entirely on the electricity tariff. On a standard tariff (26p/kWh), a heat pump costs roughly £60–£120 per year more than a modern gas boiler. On a heat-pump-specific tariff (around 14p/kWh), it is approximately £250 per year cheaper. Against an old, inefficient G-rated boiler, a heat pump saves around £340 per year regardless of tariff.
- Median ASHP install cost: £12,500 (official BUS statistics 2024/25)
- Government grant (Boiler Upgrade Scheme): £7,500 for ASHP
- Net cost after grant: ~£5,000
- Gas boiler replacement: ~£2,000–£4,500 (industry estimate only)
- Standard tariff (26p/kWh): heat pump ~£60–£120/yr more than modern gas boiler
- Heat-pump tariff (14p/kWh): heat pump ~£250/yr cheaper than gas
- Vs old G-rated boiler: heat pump ~£340/yr cheaper regardless of tariff
- 49,136 heat pumps installed under BUS since 2022; 97% air source
- Insulation no longer required as BUS precondition (since May 2024)
- Source: DESNZ BUS Business Case 2026; Ofgem BUS Annual Report 2024–25; Energy Saving Trust / GOV.UK (2024)
Read Before You Record
The headline changes are robust, but the accounting boundary, comparison period, and assumed energy tariff affect the conclusion. Keep these three qualifications with any retelling of the brief.
- Territorial emissions are the statutory basis of the UK’s net zero target, but they exclude the greenhouse gases embedded in imported goods and services. Consumption-based estimates are published later and use a different accounting boundary, so they should not be treated as interchangeable annual series.
- International comparisons depend on the dataset, gases covered, treatment of land use (LULUCF), and baseline. The G7 comparison here excludes LULUCF and uses 2023 as the latest common source year.
- Heat-pump running costs are illustrative rather than a universal household saving. They depend on the property’s heat demand, insulation, heat-pump efficiency, boiler efficiency, gas and electricity prices, and — above all in this comparison — the electricity tariff selected.
Sources
The full source list below links to the underlying official data and supporting analysis used in this brief.
- DESNZ, Final UK Greenhouse Gas Emissions Statistics 1990–2024
- DESNZ, Energy Trends ET5.1 and DUKES Chapter 5
- Defra/ONS, UK Carbon Footprint to 2023
- French SDES/EDGAR comparative dataset
- Ofgem, Price Cap October–December 2025
- UKERC, The Price of Power (2025)
- DESNZ, Boiler Upgrade Scheme Business Case (2026)