Poverty
14.3 million people in the UK are in poverty. Two thirds of working-age poor adults are in employment. Child poverty is rising back toward its 1990s peak. The data is clearer than the debate.
The Data Context
The UK has 14.3 million people in relative poverty after housing costs, but no single figure captures the whole picture. HBAI tracks income against a median-based threshold; JRF's destitution measure records people unable to meet basic material needs; before- and after-housing-costs measures can reverse regional rankings. The six graphics below show why poverty is not simply an unemployment story, why housing changes the map, and why the measure chosen changes the political conclusion.
Child Poverty Has Nearly Reversed Its Own Progress
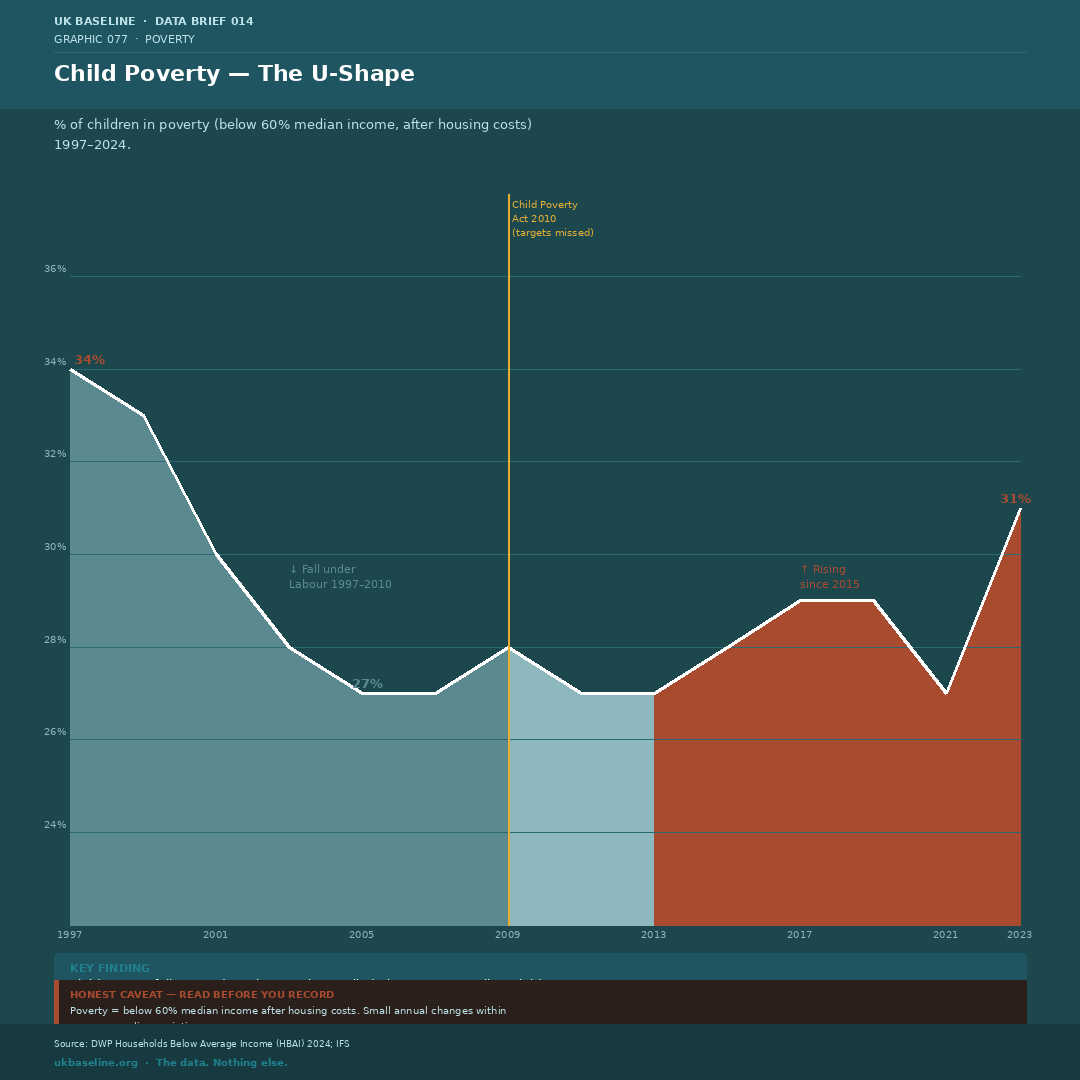
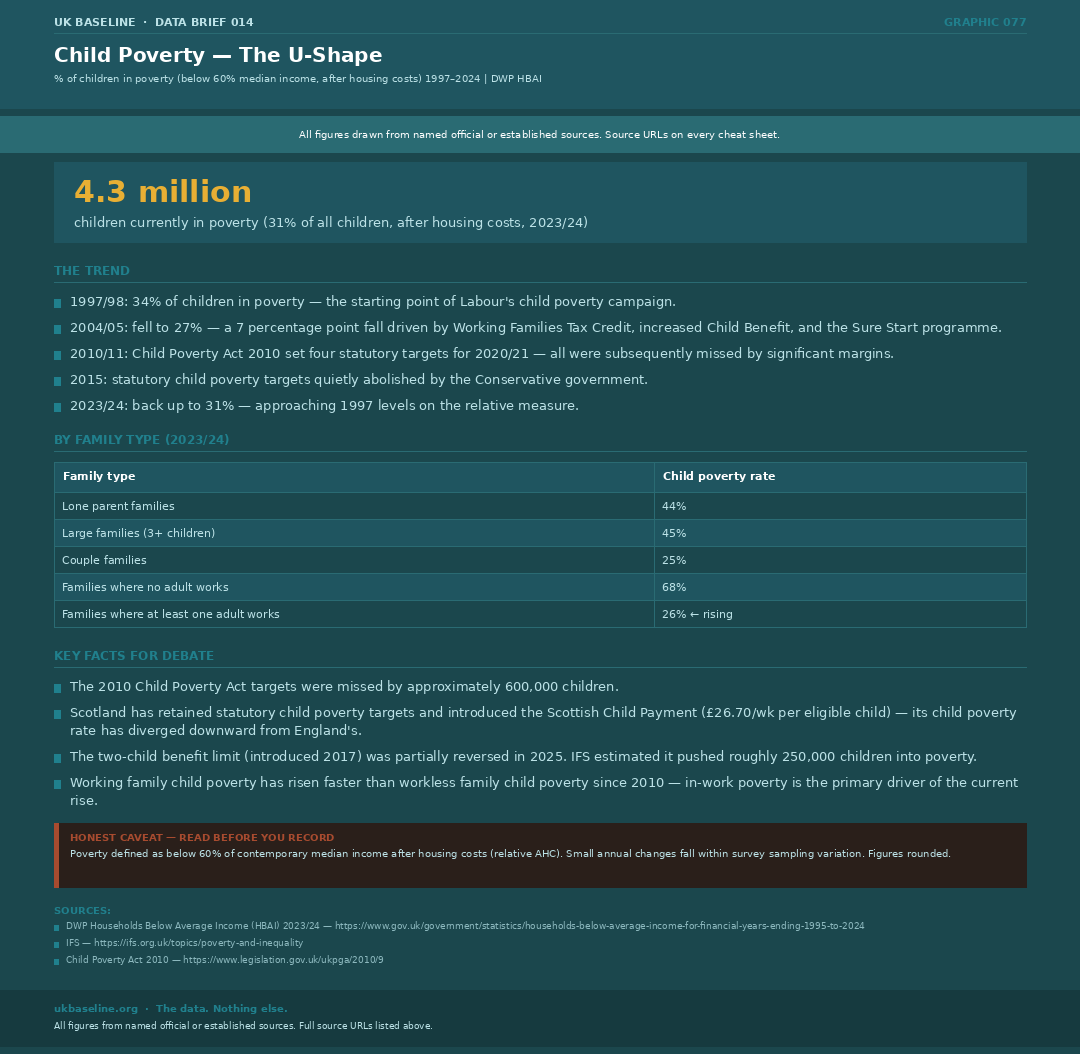
Child poverty fell from 34% in 1997/98 to 27% in 2004/05 — a 7 percentage point fall under sustained Labour investment in Working Families Tax Credit, Child Benefit, and Sure Start. It has since risen back to 31% in 2023/24. The Child Poverty Act 2010 set statutory targets for 2020/21; all were missed by significant margins and then abolished in 2015. Lone parent families face a 44% rate; large families (3+ children) 45%.
- 1997/98: 34% of children in poverty — the starting point of Labour's reduction campaign
- 2004/05: fell to 27% — 7pp fall driven by Working Families Tax Credit, Child Benefit increases, and Sure Start
- Child Poverty Act 2010 set four statutory targets for 2020/21 — all subsequently missed
- Targets abolished 2015; Scotland retained its own statutory targets and introduced the Scottish Child Payment (£26.70/wk per eligible child)
- Two-child benefit limit (introduced 2017, partially reversed 2025) pushed approximately 250,000 children into poverty (IFS)
- Working family child poverty is now rising faster than workless family child poverty — a job is no longer sufficient protection
- Source: DWP HBAI 2023/24; IFS; Child Poverty Act 2010
Two Thirds of Working-Age Adults in Poverty Are in Employment
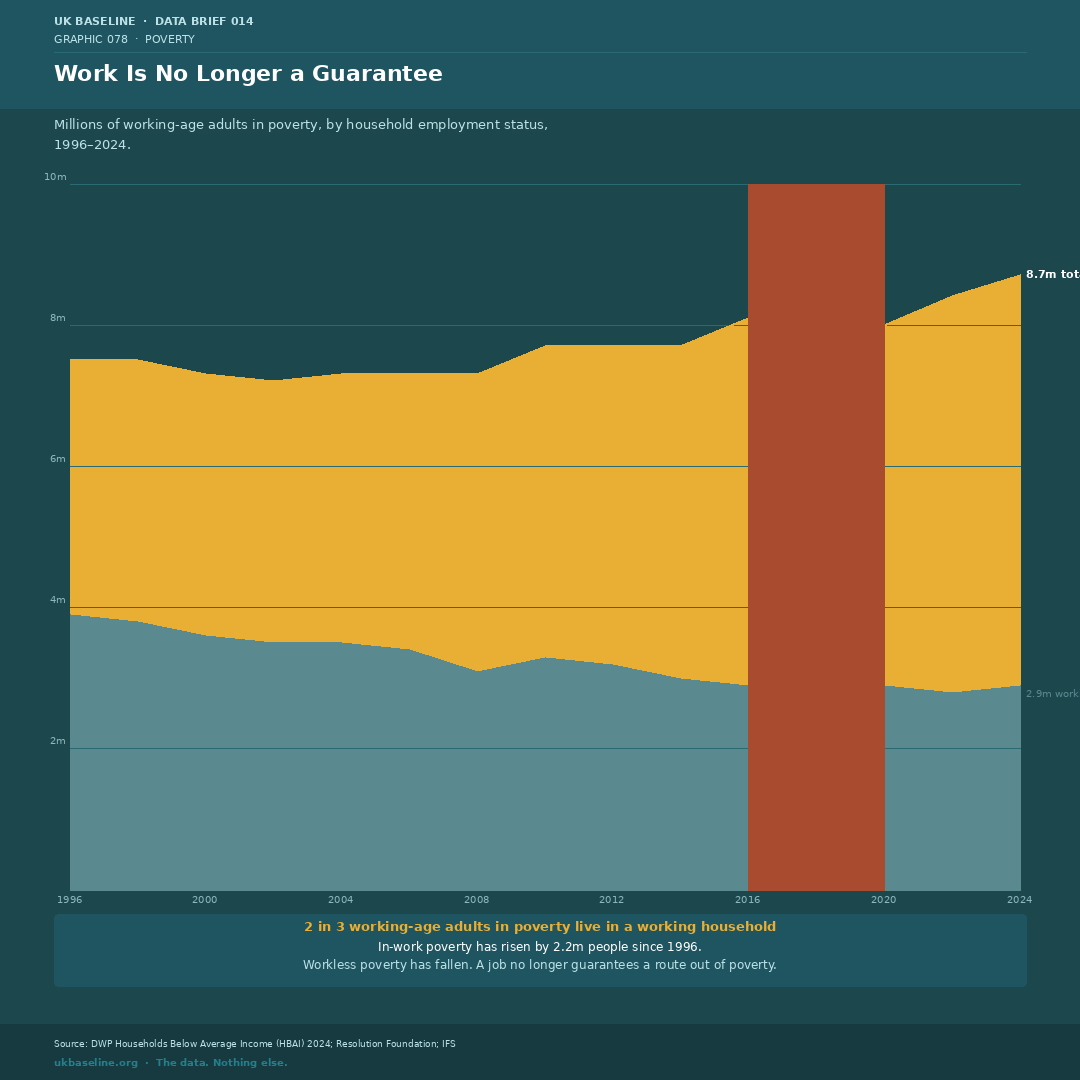
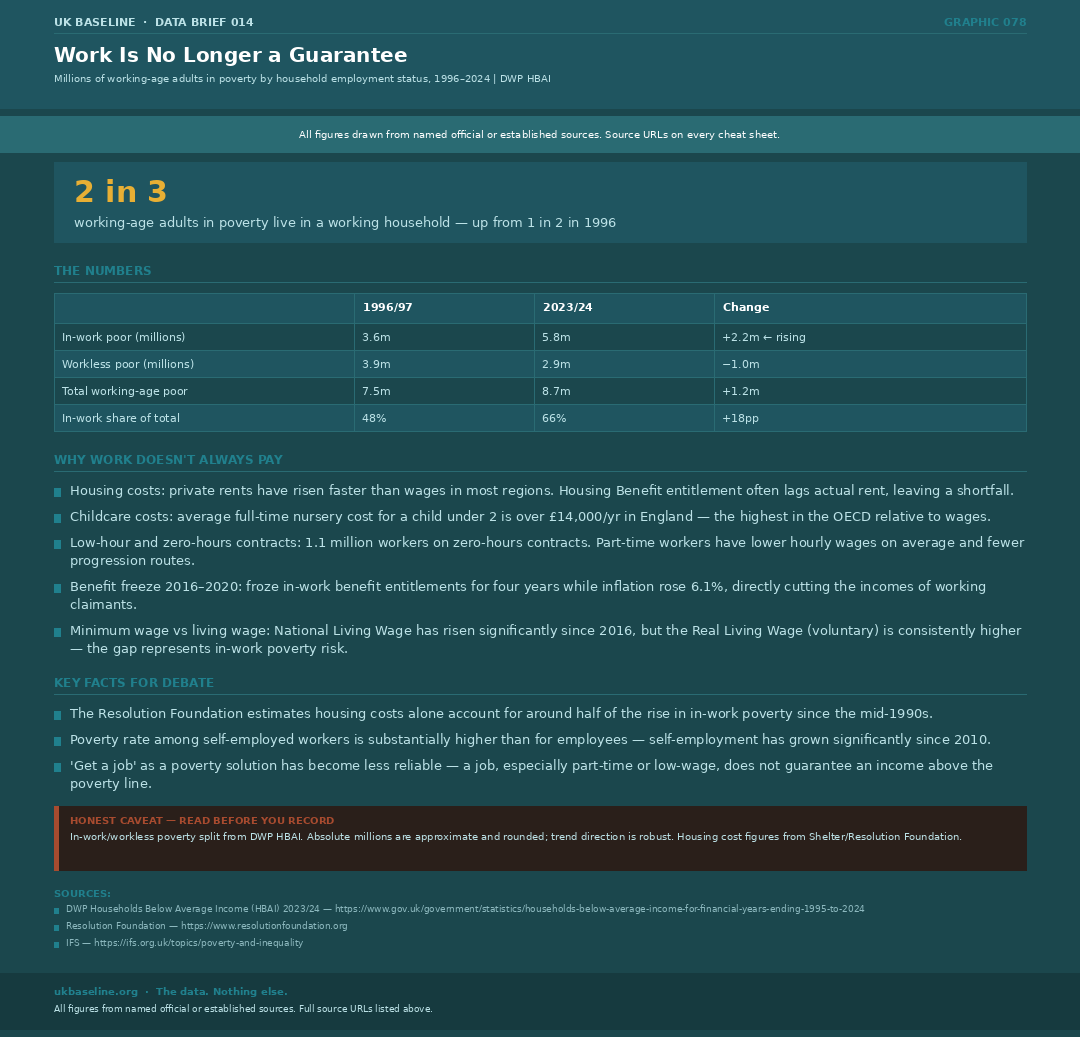
In 1996/97, around half of working-age adults in poverty lived in a working household. By 2023/24, that figure is two thirds — 5.8 million people in poverty despite being in employment. Workless poverty has fallen. In-work poverty has risen by 2.2 million people. Housing costs, childcare costs, and the spread of low-hour contracts are the primary drivers. The benefit freeze (2016–2020) directly cut the in-work benefits of working claimants for four consecutive years.
- In-work poor: 3.6m (1996/97) → 5.8m (2023/24) — a 2.2m rise
- Workless poor: 3.9m (1996/97) → 2.9m (2023/24) — falling
- Housing Benefit / LHA rates have not kept pace with actual rents; many working renters face a gap
- Average full-time nursery cost for a child under 2 exceeds £14,000/yr in England — OECD highest relative to wages
- 1.1 million workers on zero-hours contracts; self-employed poverty rate substantially above employee rate
- Resolution Foundation: housing costs account for roughly half of the rise in in-work poverty since the mid-1990s
- Source: DWP HBAI 2023/24; Resolution Foundation; IFS
3.8 Million People Experienced Destitution in 2023
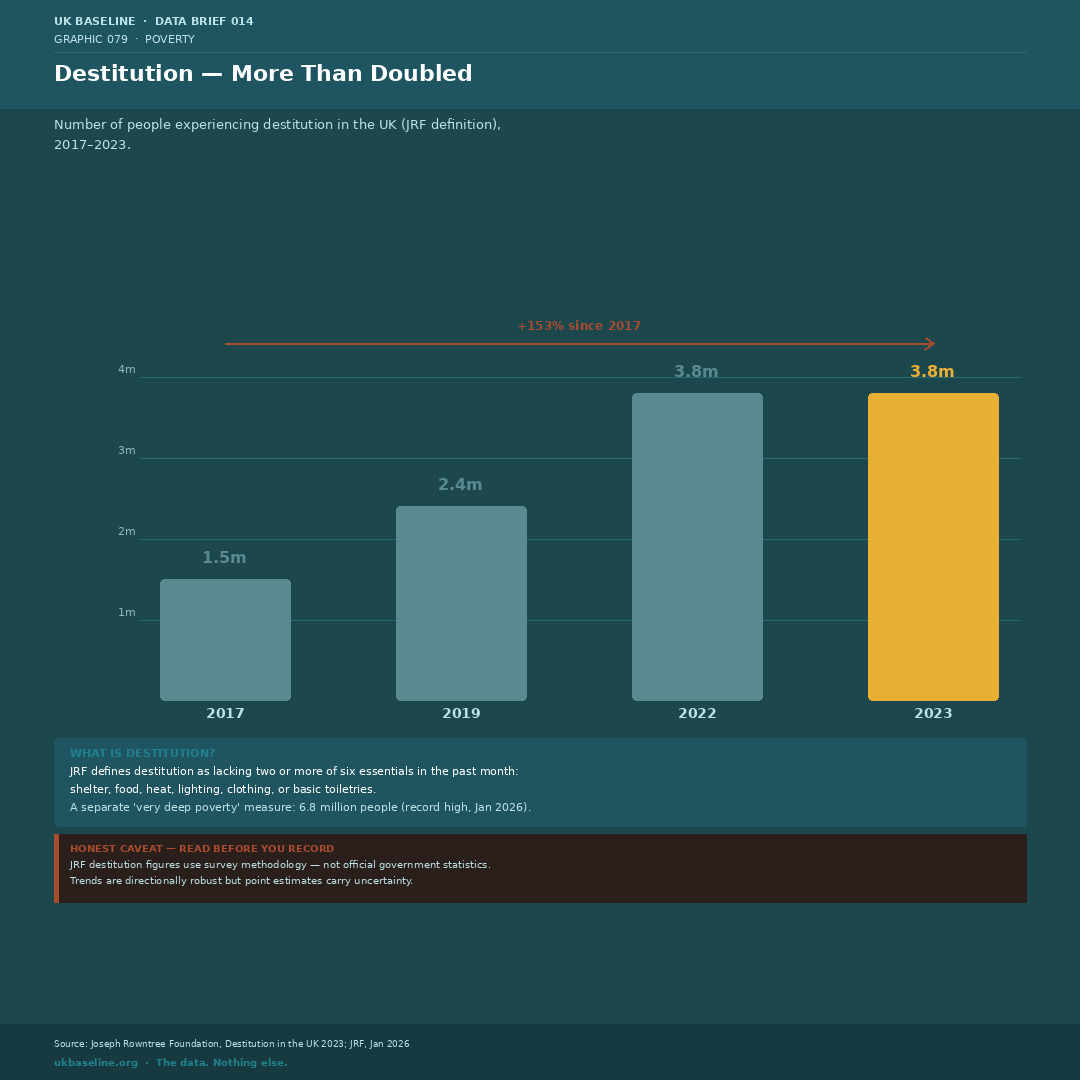
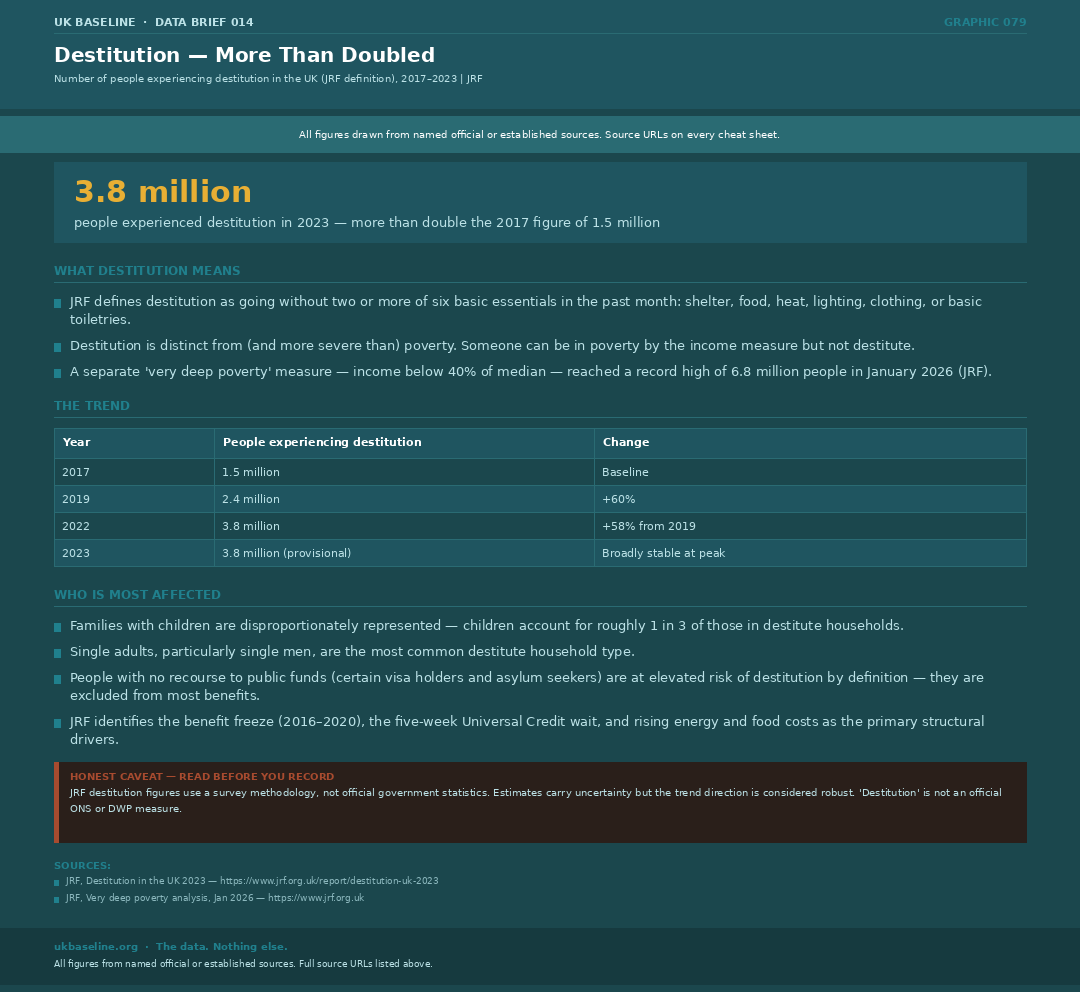
Destitution — defined by JRF as going without two or more of six basic essentials (shelter, food, heat, lighting, clothing, toiletries) in the past month — affected 3.8 million people in 2023. That is more than double the 1.5 million recorded in 2017. A separate JRF measure of very deep poverty (below 40% of median income) reached a record high of 6.8 million in January 2026. JRF identifies the benefit freeze, the five-week Universal Credit wait, and rising food and energy costs as the structural drivers.
- 2017: 1.5m in destitution | 2019: 2.4m | 2022–23: 3.8m — a 153% rise since 2017
- Destitution is distinct from poverty — it measures material deprivation, not income relative to a threshold
- Families with children are disproportionately represented; children account for roughly 1 in 3 of those in destitute households
- People with no recourse to public funds (certain visa and asylum status holders) face destitution by design — they are excluded from most benefits
- Very deep poverty (below 40% median): 6.8 million — record high (JRF, Jan 2026)
- Source: JRF, Destitution in the UK 2023; JRF Jan 2026 analysis
London Has the Highest Poverty Rate in England — Because of Housing, Not Income
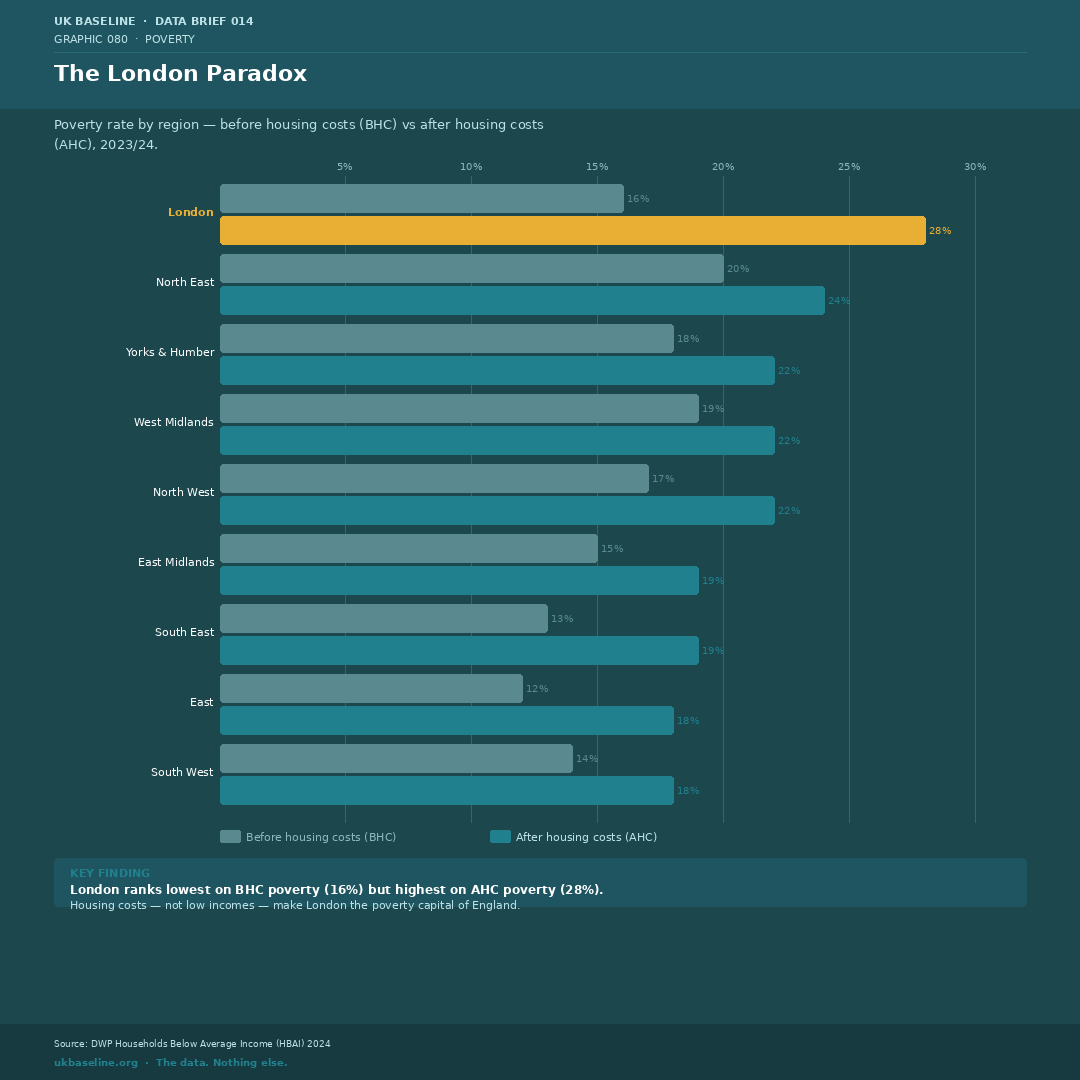
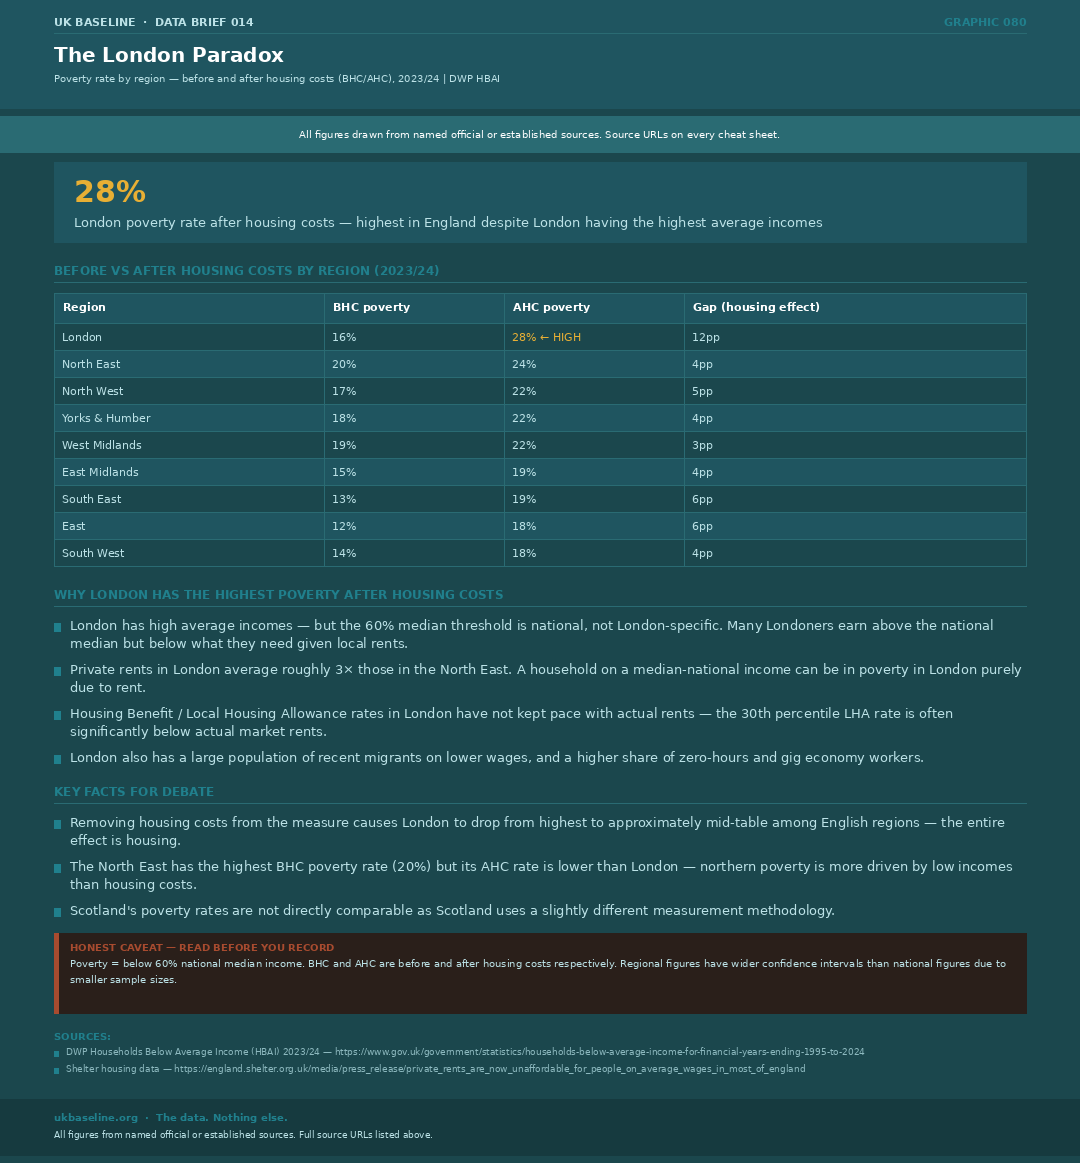
London has the lowest before-housing-costs poverty rate of any English region at 16%. After housing costs, it becomes the highest at 28% — a 12 percentage point swing driven entirely by private rents. The North East has the highest poverty rate on a before-housing-costs basis, reflecting genuinely lower incomes. Whether London is “rich” or “poor” depends entirely on which measure you use.
- London BHC poverty: 16% (lowest in England) → London AHC poverty: 28% (highest in England)
- North East BHC: 20% (highest) → North East AHC: 24%
- The 60% median poverty threshold is national, not London-specific — high London rents consume income above the national median
- Housing Benefit / LHA rates set at 30th percentile of local rents — often significantly below actual market rent, leaving a shortfall
- South East and East also show a large BHC→AHC gap (6pp) reflecting commuter-belt housing costs
- Source: DWP HBAI 2023/24; Shelter housing data
The 2016–2020 Benefit Freeze Cut Real-Terms Incomes for 27 Million People
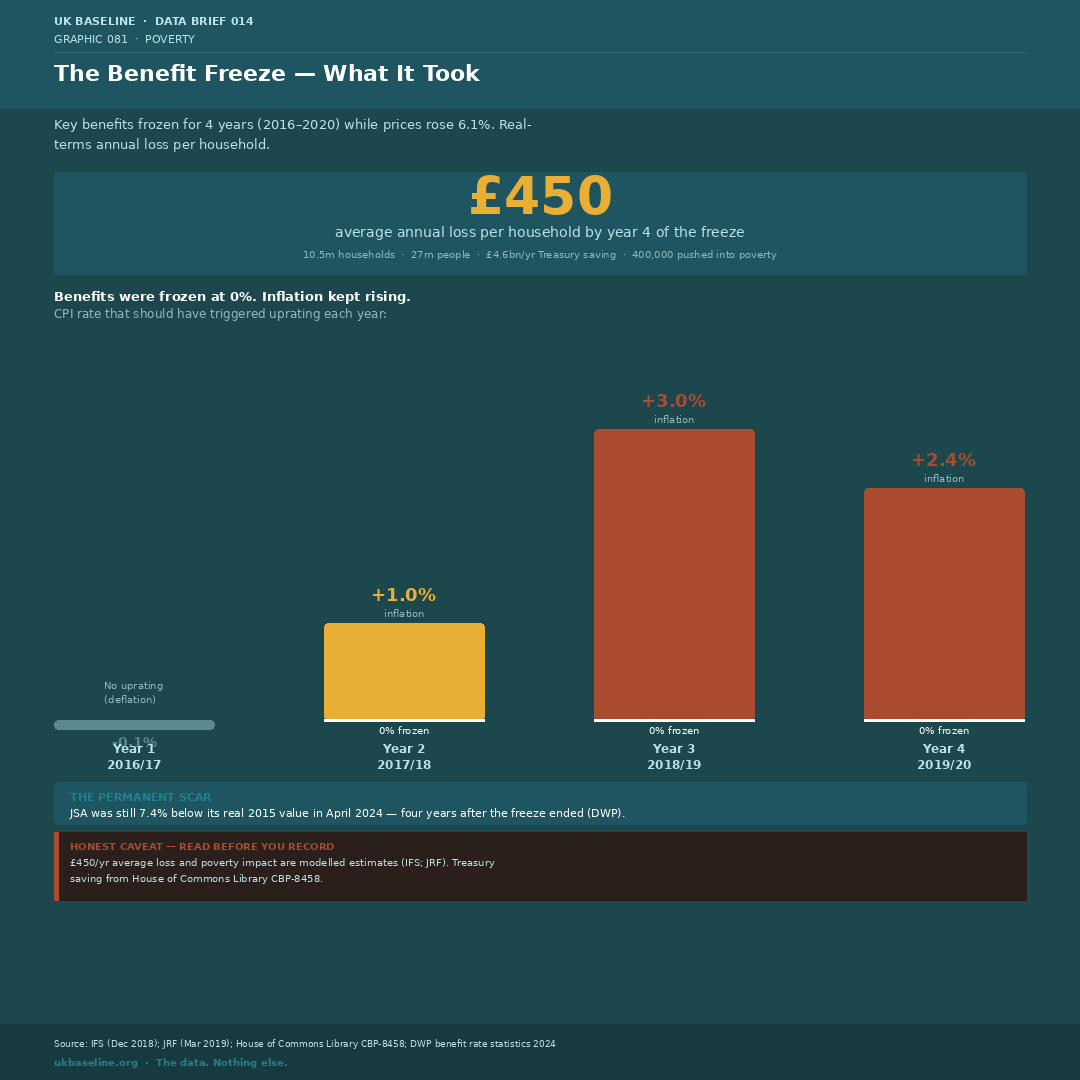
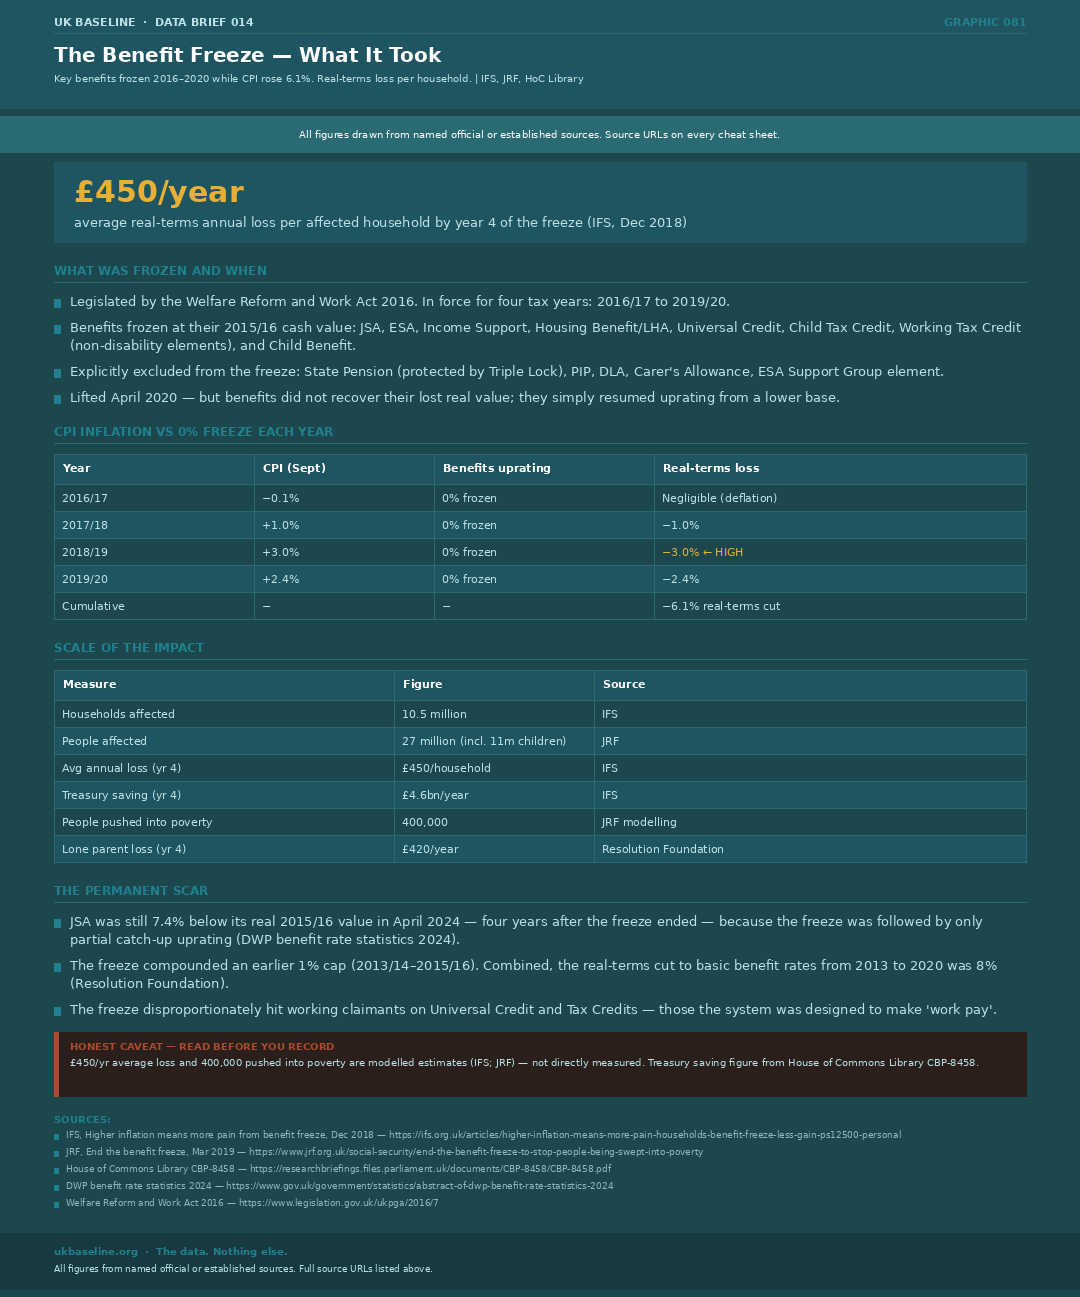
The Welfare Reform and Work Act 2016 froze the cash value of most working-age benefits for four consecutive years while CPI inflation rose a cumulative 6.1%. By year four, affected households were £450 per year worse off on average. 10.5 million households were affected; JRF estimates 400,000 people were pushed into poverty as a direct result. The Treasury saved £4.6bn per year by 2019/20. JSA remained 7.4% below its real 2015 value as recently as April 2024 — four years after the freeze ended.
- Benefits frozen 2016/17–2019/20: JSA, ESA, Income Support, Housing Benefit/LHA, Universal Credit, Child/Working Tax Credit, Child Benefit
- Explicitly excluded: State Pension (Triple Lock protected), PIP, DLA, Carer’s Allowance
- CPI each year: −0.1% (yr1), +1.0% (yr2), +3.0% (yr3), +2.4% (yr4) — cumulative −6.1% real terms
- Average loss by year 4: £450/household (IFS); lone parents: £420/yr; couple with 2 children: £570/yr (Resolution Foundation)
- The freeze compounded an earlier 1% cap (2013–2016): combined real-terms cut from 2013 to 2020 was 8% (Resolution Foundation)
- JSA still 7.4% below real 2015 value in April 2024 — the freeze left a permanent scar (DWP benefit rate statistics 2024)
- Source: IFS (Dec 2018); JRF (Mar 2019); House of Commons Library CBP-8458; DWP benefit rate statistics 2024; Welfare Reform and Work Act 2016
Relative and Absolute Poverty Tell Different Stories — Both Are Real
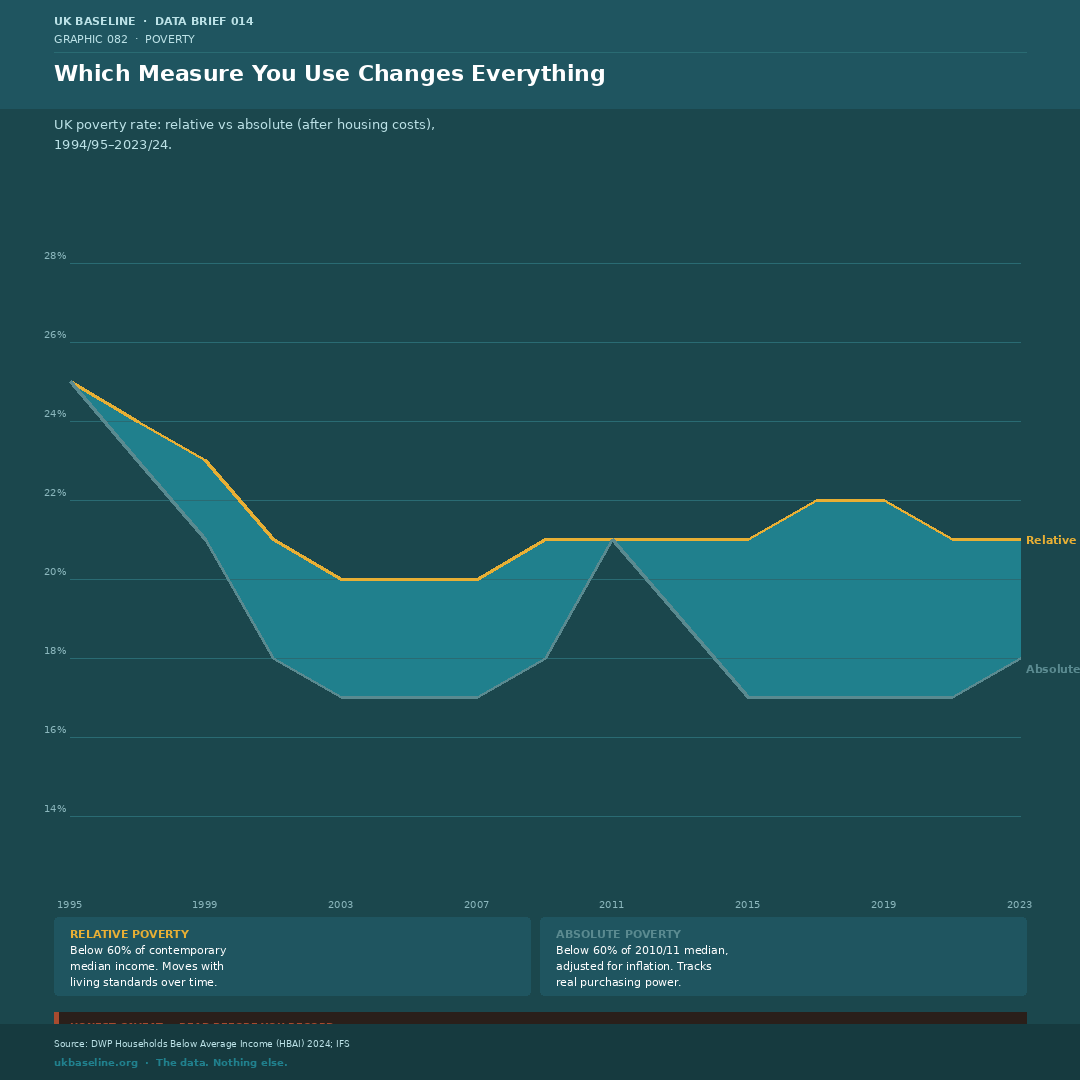
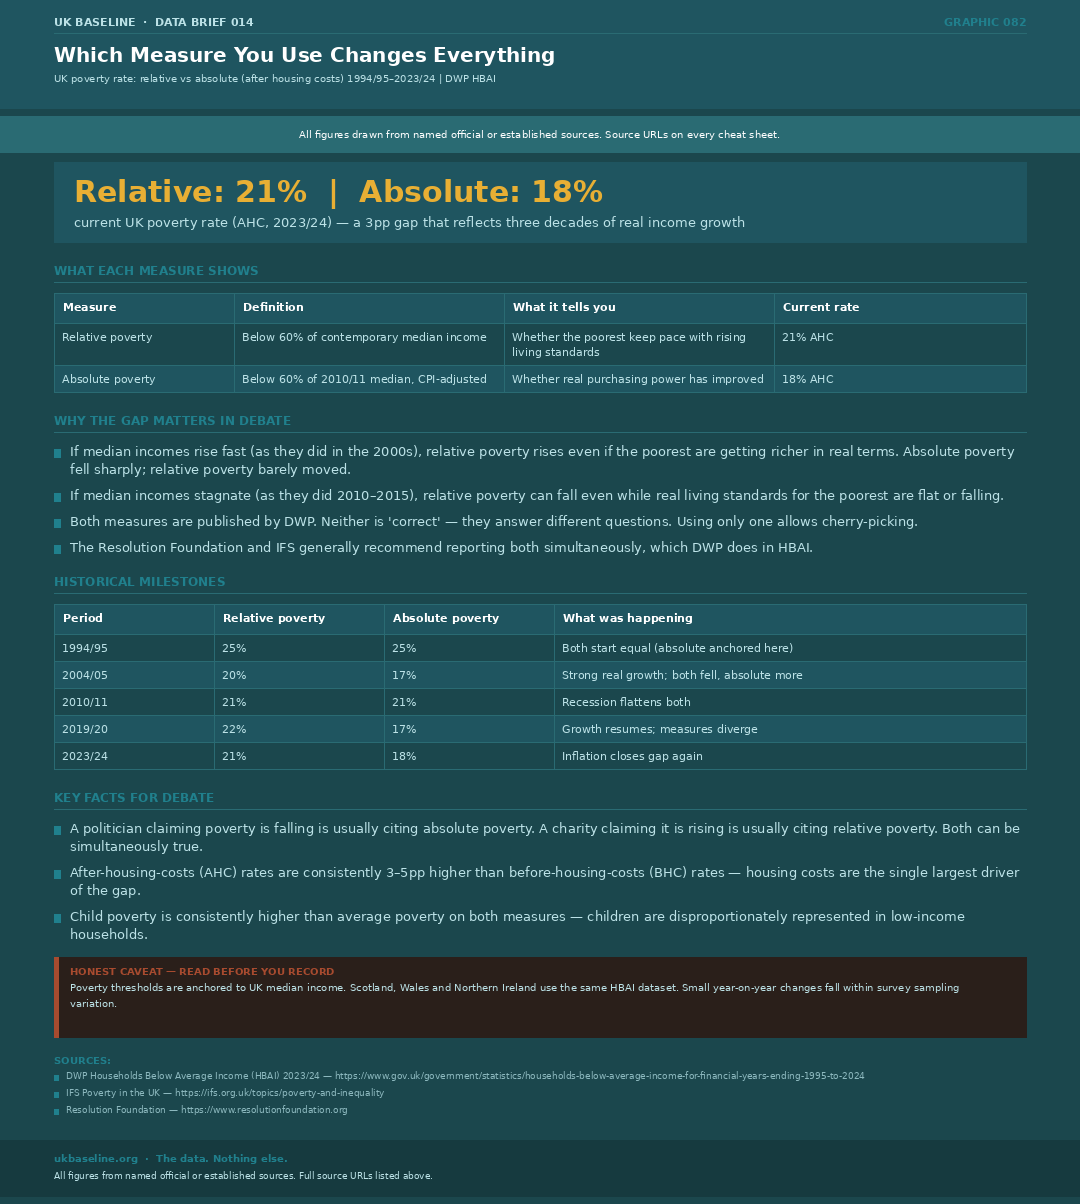
The UK poverty rate is simultaneously 21% (relative, after housing costs) and 18% (absolute, after housing costs). Relative poverty measures whether the poorest keep pace with rising living standards; absolute poverty measures whether real purchasing power has improved. Both are published by DWP in HBAI. A politician claiming poverty is falling is almost always citing absolute poverty. A charity claiming it is rising is almost always citing relative poverty. Both can be simultaneously true.
- Relative poverty: below 60% of contemporary median income — moves with living standards; currently 21% AHC
- Absolute poverty: below 60% of 2010/11 median, CPI-adjusted — tracks real purchasing power; currently 18% AHC
- The 3pp gap reflects three decades of real income growth — in a growing economy, absolute poverty tends to fall faster than relative poverty
- In the 2000s, both fell sharply. In the 2010–2015 stagnation, relative poverty fell while absolute was flat — the opposite political signal
- After-housing-costs rates are 3–5pp higher than before-housing-costs on both measures — housing is the single largest driver of measurable poverty
- Child poverty is consistently higher than average poverty on both measures
- Source: DWP HBAI 2023/24; IFS; Resolution Foundation
Read Before You Record
The headline numbers are robust, but the definition, housing-cost treatment, and time period matter. Keep these three qualifications with any retelling of the brief.
- Relative poverty is an income threshold set at 60% of the contemporary median. It is designed to measure whether lower-income households share in changes in living standards; it is not a direct count of material hardship. Always state whether a figure is relative or absolute, and whether it is before or after housing costs.
- HBAI estimates are survey-based and represent financial years. The 2023/24 figures pre-date later policy changes and do not directly measure every household's experience of food, heat, or shelter deprivation.
- Destitution is a different and more severe measure than relative poverty. JRF's definition captures acute inability to meet basic needs, so its totals should not be added to or compared as if they were an alternative count of all people in poverty.
Sources
The full source list below links to the underlying official data and supporting analysis used in this brief.
- DWP, Households Below Average Income (HBAI) 2023/24
- Institute for Fiscal Studies, Poverty and Inequality
- Joseph Rowntree Foundation, Destitution in the UK 2023
- House of Commons Library, Poverty in the UK: statistics (CBP-8458)
- Resolution Foundation publications
- Welfare Reform and Work Act 2016
- DWP, Abstract of benefit rate statistics 2024
- Shelter, housing policy and research
- Child Poverty Act 2010