The Tax Burden
Who pays, how much, and where it's heading.
The Data Context
The UK income tax system concentrates liability sharply at the top — the top 1% of taxpayers pay 27.2% of all income tax, while the bottom 50% pay 9.9%. That ratio has held above 2:1 for over two decades. At the same time, the overall tax burden is rising toward a post-war high driven not by headline rate changes but by frozen thresholds pulling millions into higher bands. Neither the "soak the rich" narrative nor the "Britain is overtaxed" claim survives contact with the data.
Who Pays Income Tax?
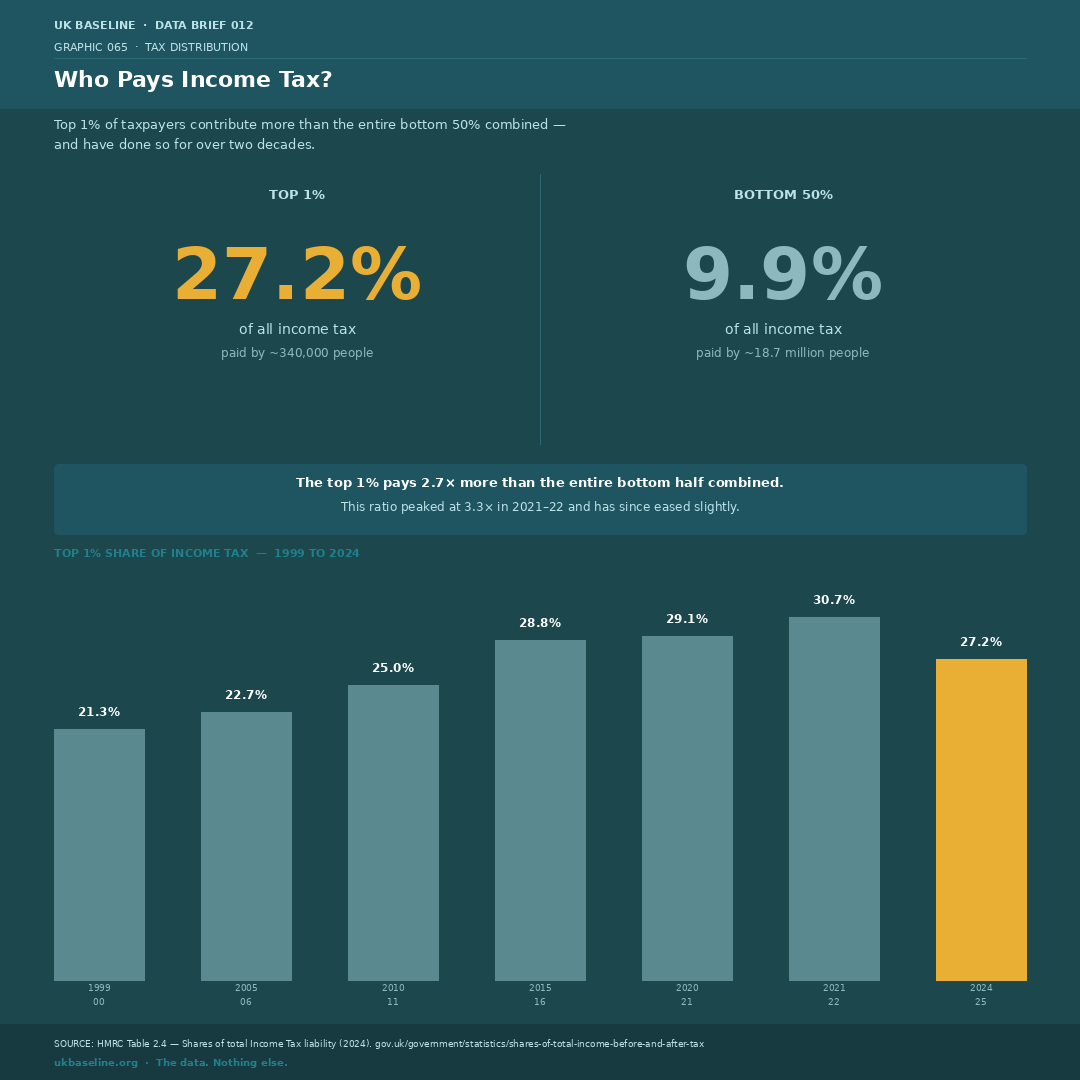
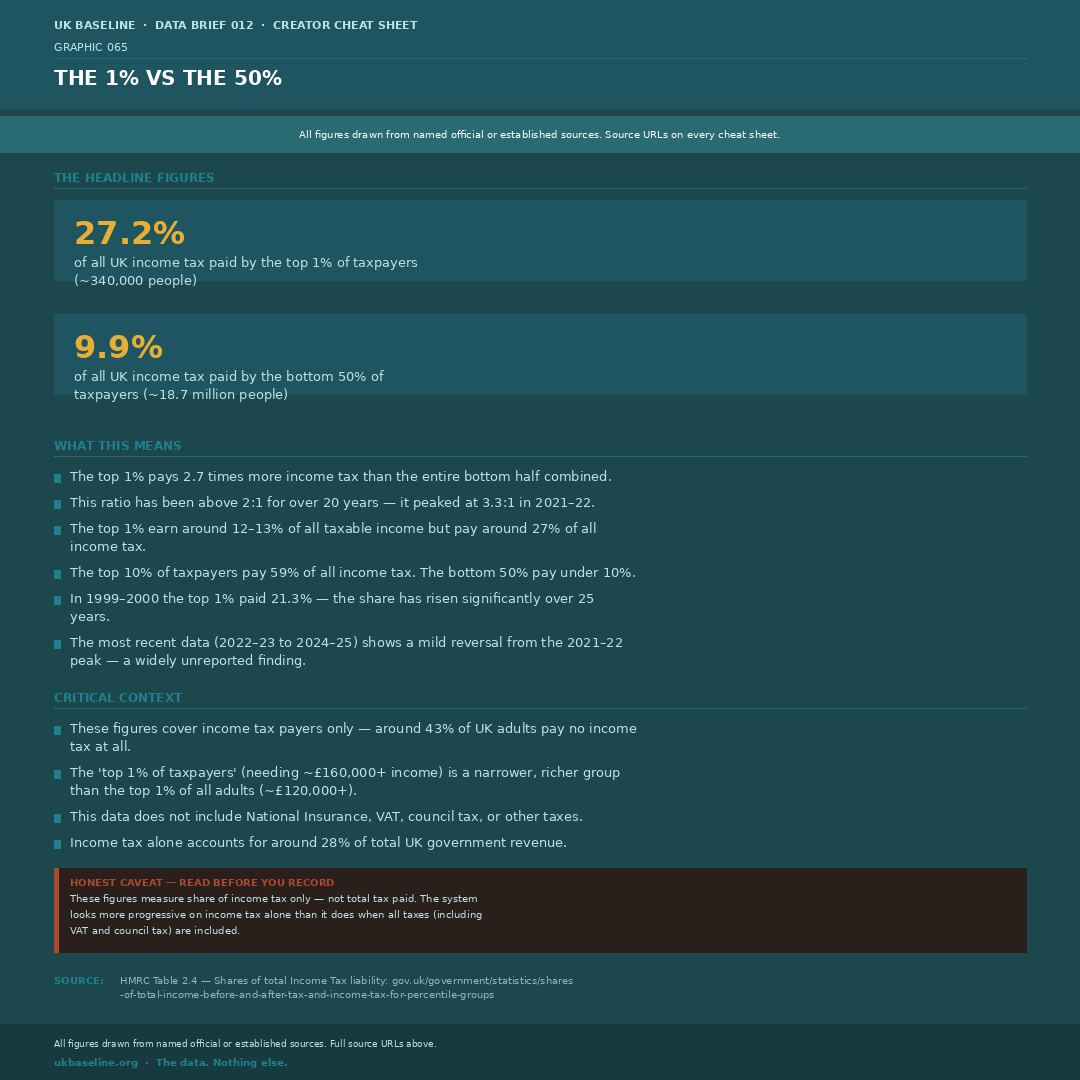
In 2023–24, the top 1% of income taxpayers — around 367,000 people — were liable for 27.2% of all income tax. The bottom 50%, some 18.7 million taxpayers, accounted for 9.9%. The top 1% contributes 2.7 times more than the entire bottom half combined, a ratio that has persisted for over two decades and peaked at 3.3:1 in 2021–22 before easing slightly in the most recent data.
- Top 10% of taxpayers pay 59% of all income tax
- The top 1% earn ~12–13% of all taxable income but pay ~27% of all income tax
- In 1999–2000 the top 1%'s share was 21.3% — it has risen substantially since
- Around 43% of UK adults paid no income tax (IFS estimate, 2014–15) — these figures cover taxpayers only
- Source: HMRC Table 2.4
A Post-War High
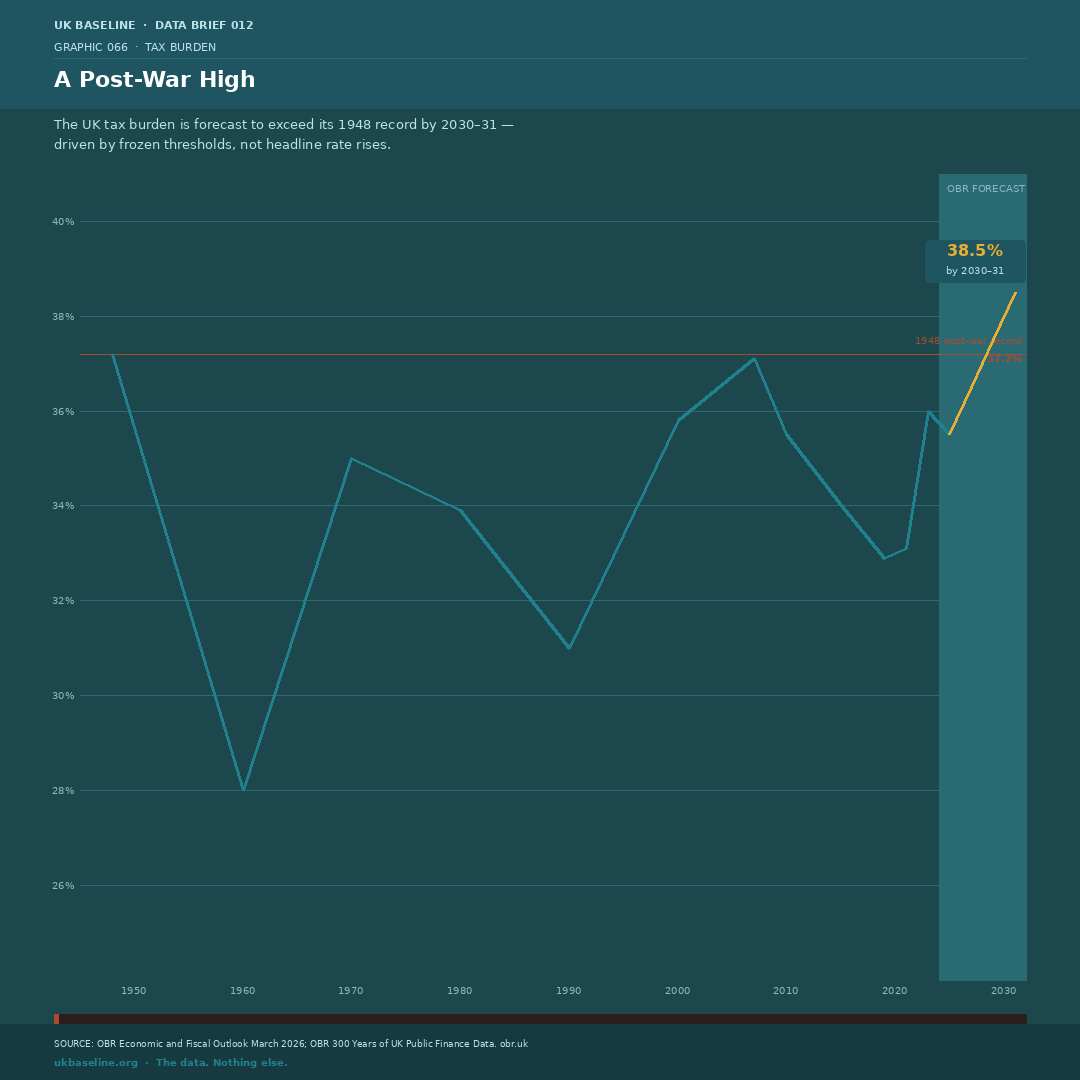
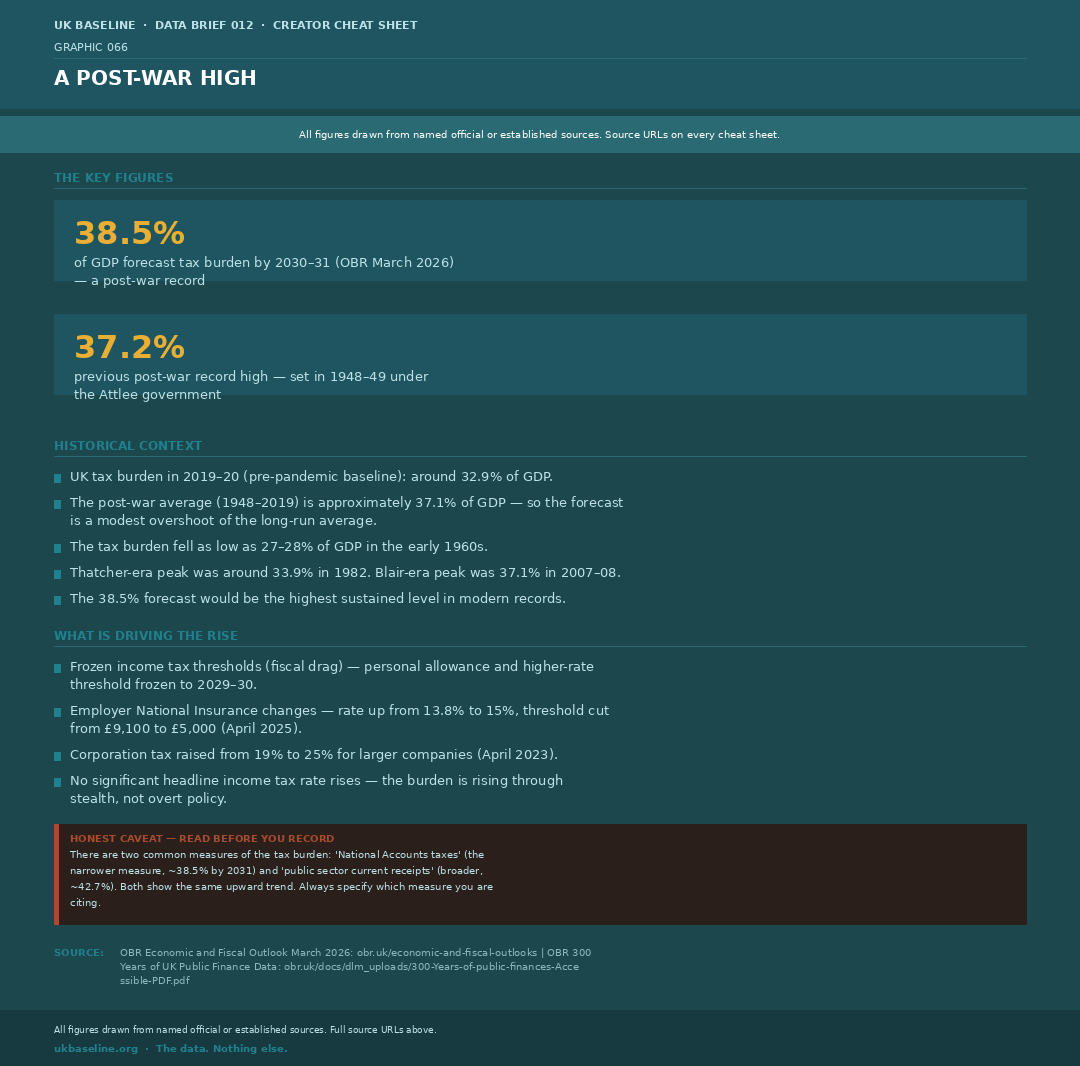
The OBR forecasts the UK tax burden will reach 38.5% of GDP by 2030–31, exceeding the previous post-war record of 37.2% set in 1948–49. The rise is not driven by headline tax rate increases but by frozen thresholds, employer National Insurance changes, and corporation tax — a structural shift rather than an explicit political choice.
- Pre-pandemic baseline (2019–20): ~32.9% of GDP
- Threshold freezes (income tax and NICs combined) were forecast to raise ~£35bn a year by 2027–28 (OBR November 2022 forecast)
- Employer NI rate rose from 13.8% to 15%, threshold cut from £9,100 to £5,000 (April 2025)
- Source: OBR Economic and Fiscal Outlook March 2026
The Stealth Tax
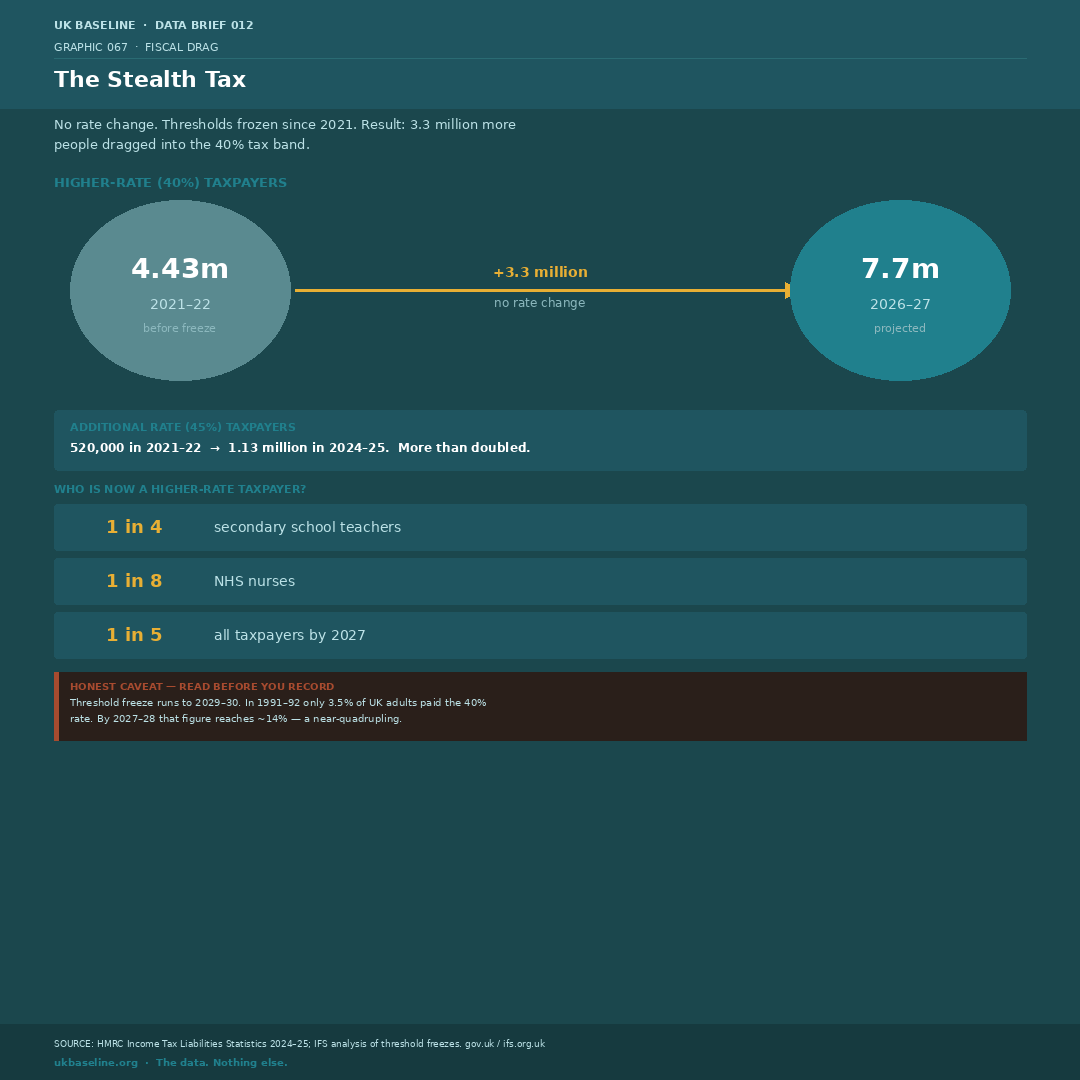
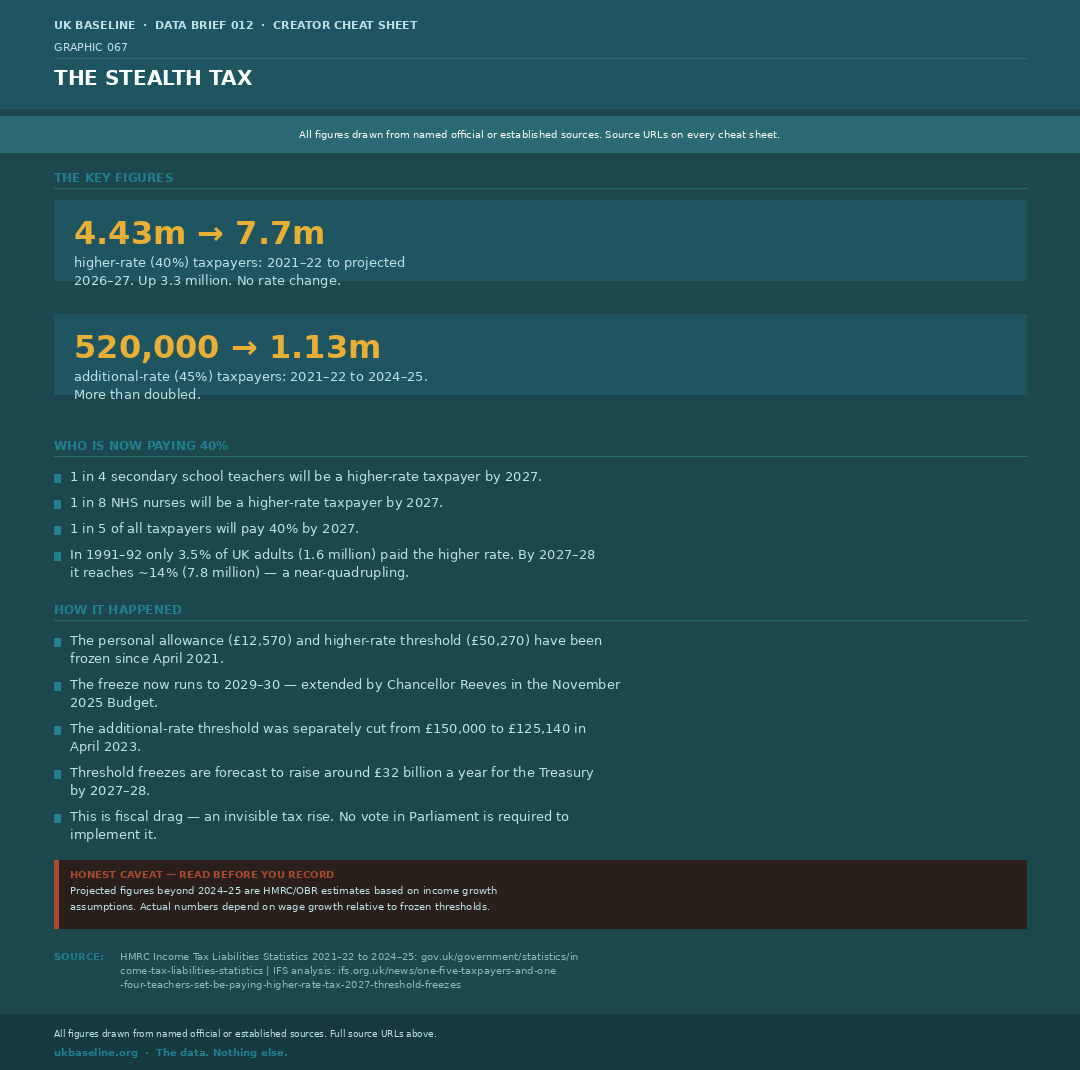
There were 4.43 million higher-rate (40%) taxpayers in 2021–22. By 2026–27 that figure is projected to reach 7.7 million — an increase of 3.3 million with no change to the 40% rate itself. This is fiscal drag: the personal allowance and higher-rate threshold have been frozen since April 2021 while wages have risen, pushing millions into a band designed for higher earners.
- By 2027, 1 in 4 secondary school teachers and 1 in 8 NHS nurses will pay the 40% rate
- Additional-rate (45%) taxpayers more than doubled: 520,000 in 2021–22 to 1.13m in 2024–25
- In 1991–92 only 3.5% of adults paid the higher rate — by 2027–28 it reaches ~14%
- The threshold freeze runs through 2030–31
- Source: HMRC Income Tax Liabilities Statistics; IFS
Progressive or Regressive?
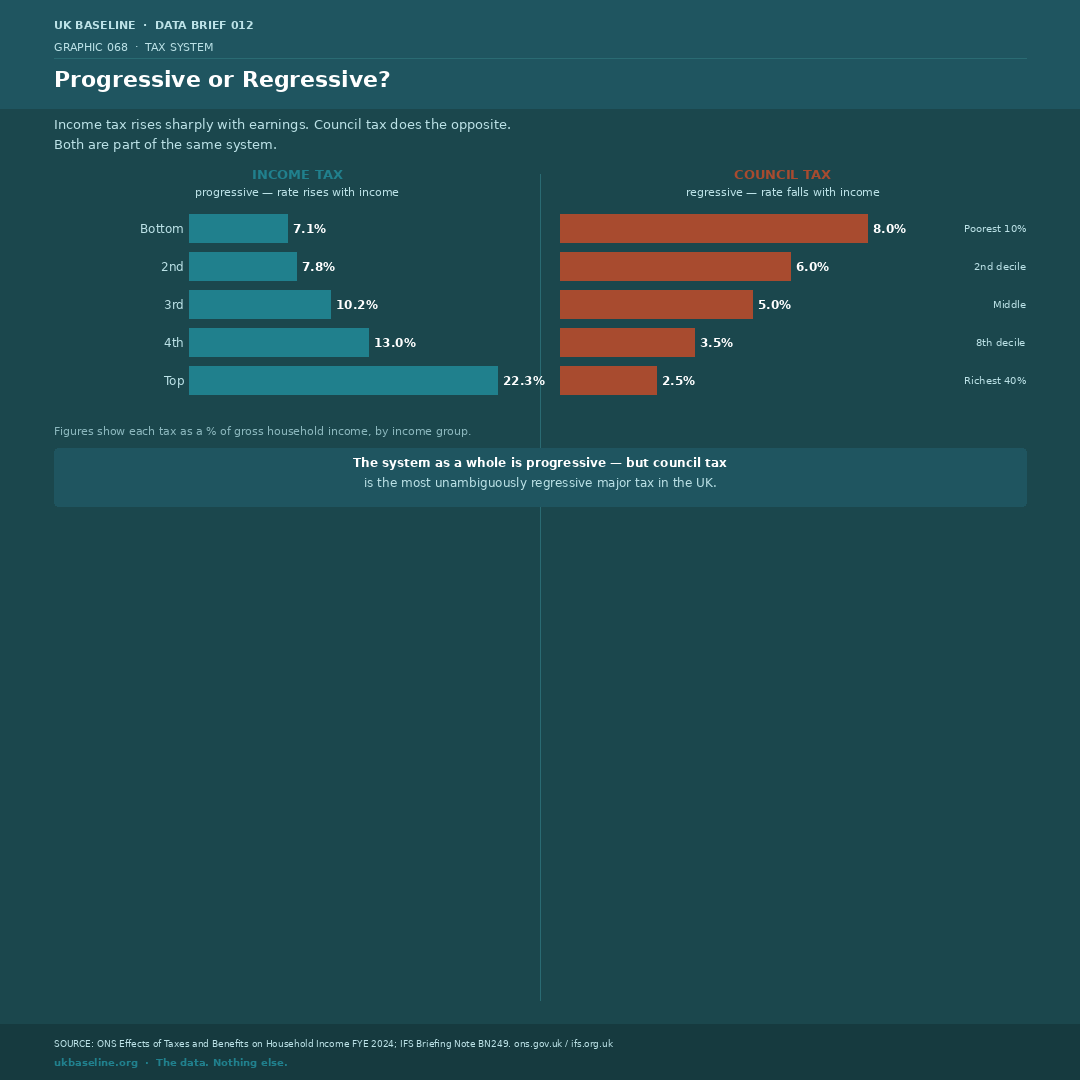
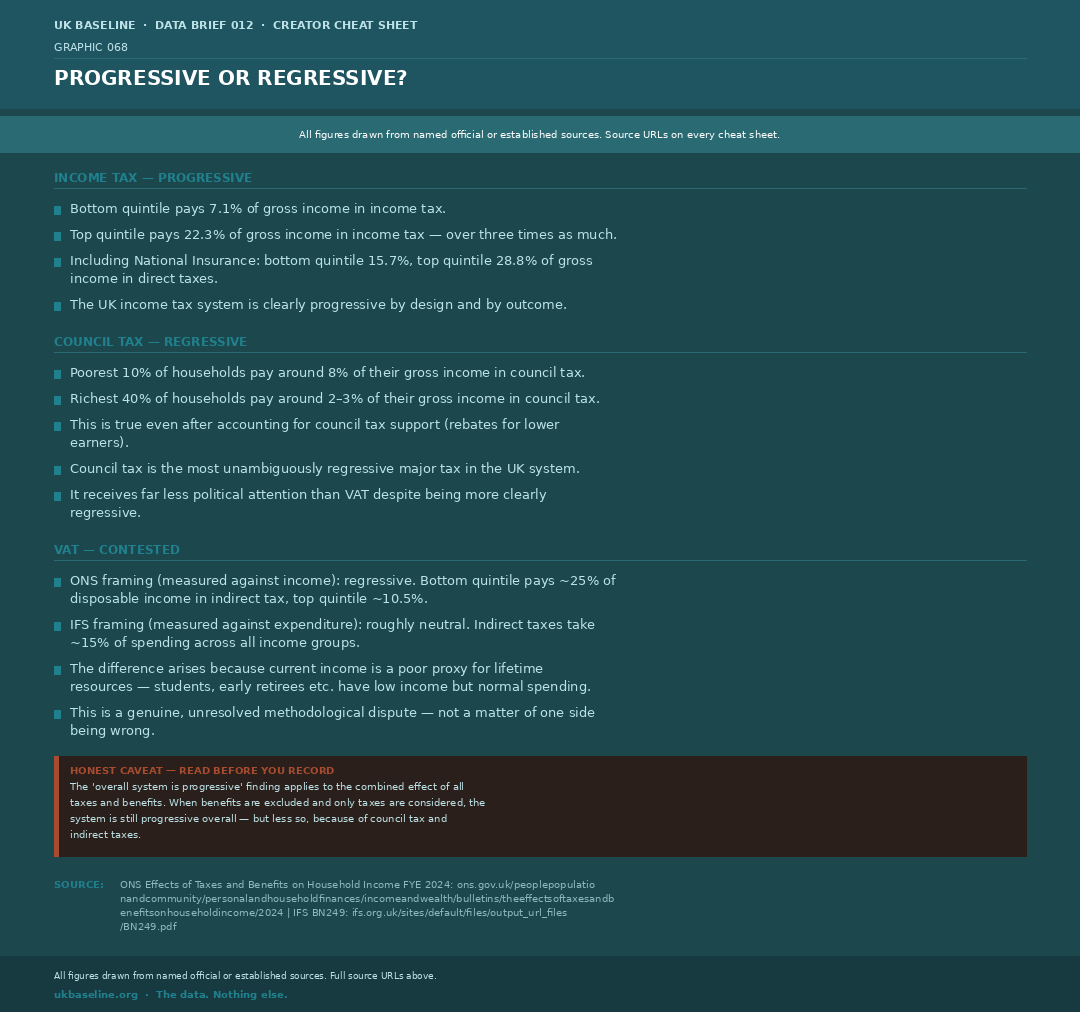
Income tax is clearly progressive — the top quintile pays 22.3% of gross income in income tax, the bottom quintile pays 7.1%. Council tax runs in the opposite direction: the poorest tenth pay around 8% of income in council tax, the richest 40% pay 2–3%. The system as a whole is progressive, but council tax is the most unambiguously regressive major tax in the UK.
- VAT's progressivity is genuinely contested — regressive when measured against income, roughly neutral when measured against expenditure (IFS vs ONS framing)
- Including NI alongside income tax: bottom quintile pays 15.7% of gross income in direct taxes, top quintile pays 28.8%
- Council tax receives far less political attention than VAT despite being more clearly regressive
- Source: ONS ETB FYE 2024; IFS BN249
Benefits Do the Heavy Lifting
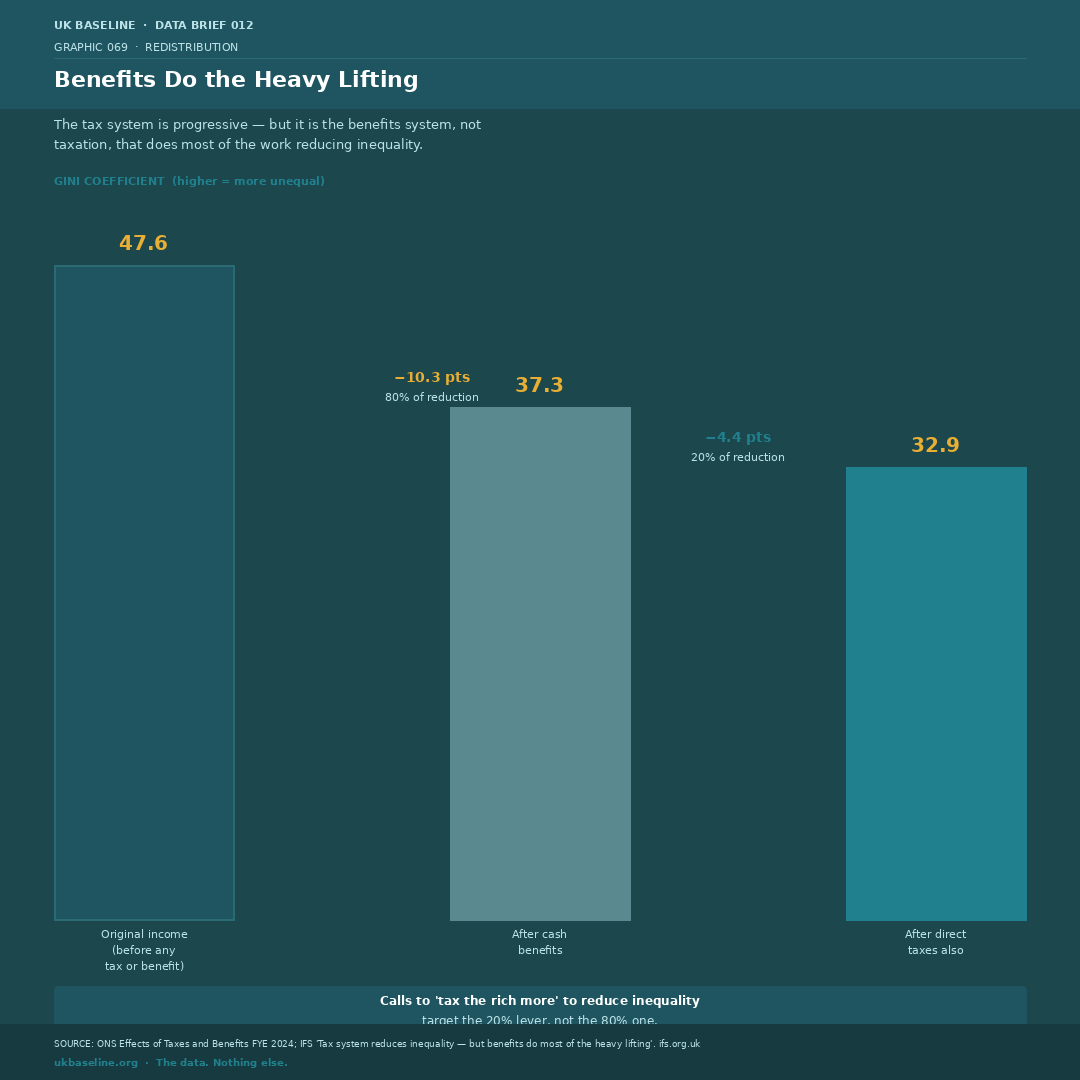
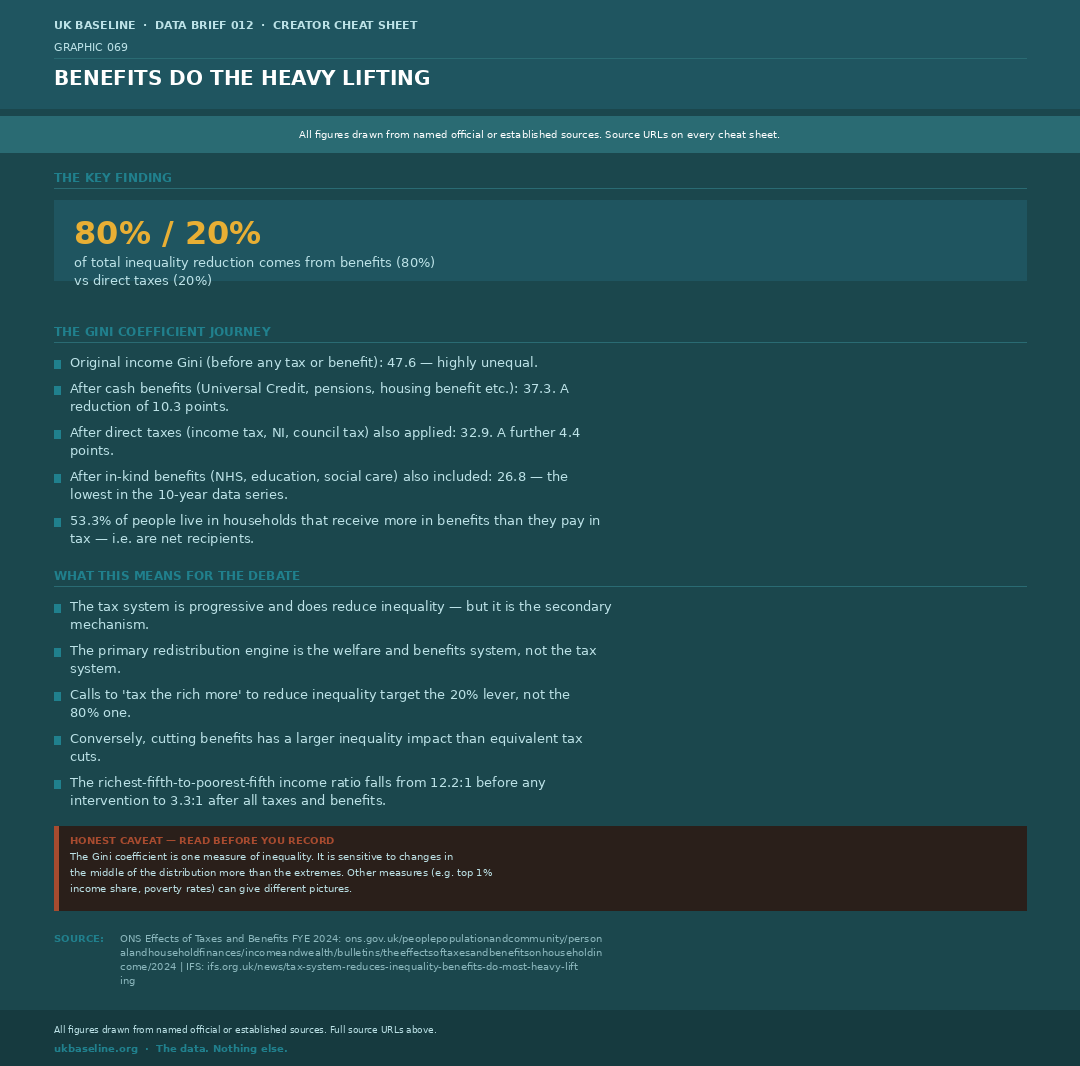
The Gini coefficient — a measure of income inequality — stands at 47.6 before any government intervention. Cash benefits reduce it to 37.3, a fall of 10.3 points. Direct taxes reduce it a further 4.4 points to 32.9. Cash benefits account for the larger share of the reduction: they reduced the Gini by 10.3 points, against 4.4 points from direct taxes.
- After all taxes and benefits (including in-kind benefits like the NHS and education), the Gini falls to 26.8
- The income ratio between the richest and poorest fifth falls from 12.2:1 to 3.3:1 after all interventions
- 53.3% of people live in households that receive more in benefits than they pay in tax
- Cutting benefits has a larger inequality impact than equivalent tax changes
- Source: ONS ETB FYE 2024; IFS
Mid-Table, Not High-Tax
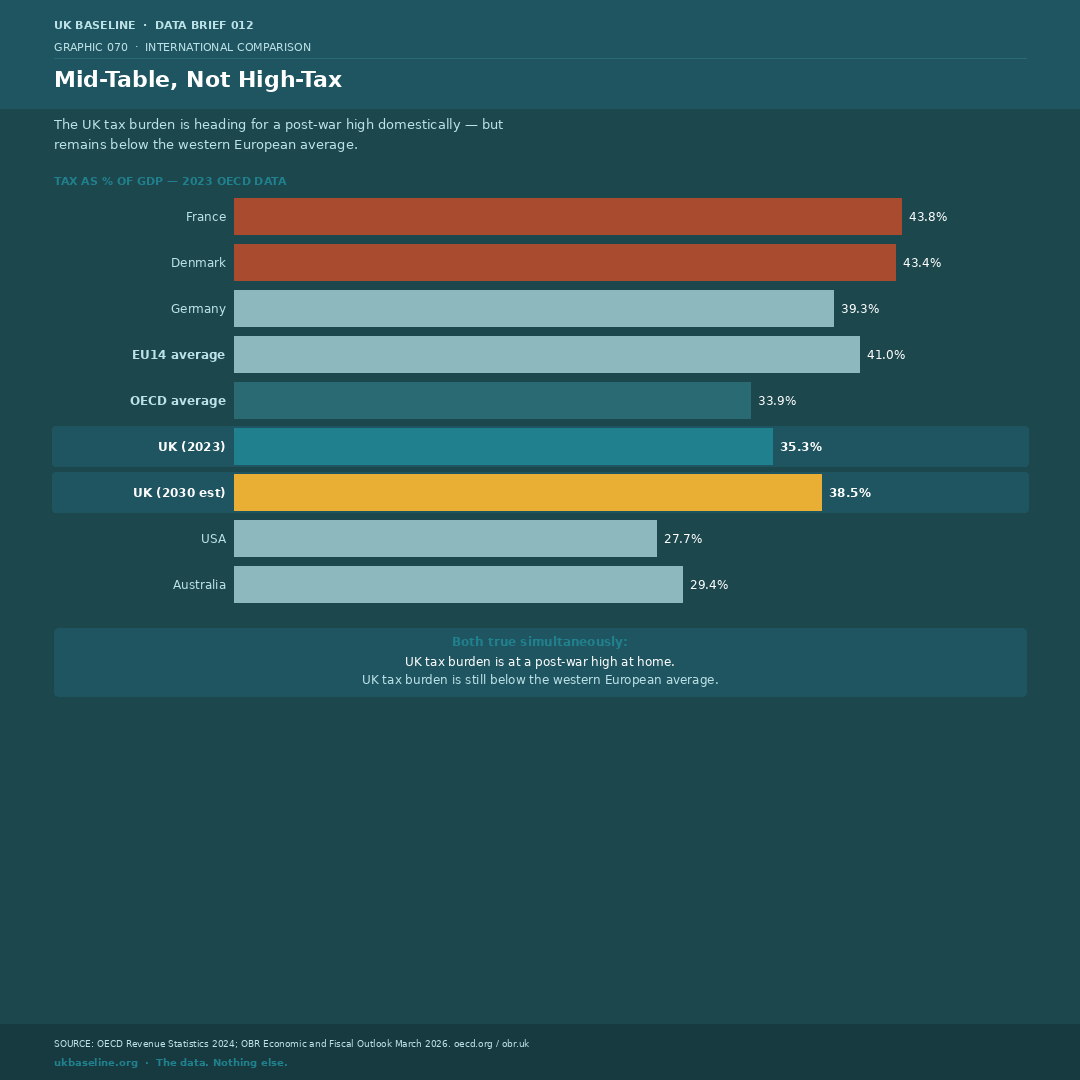
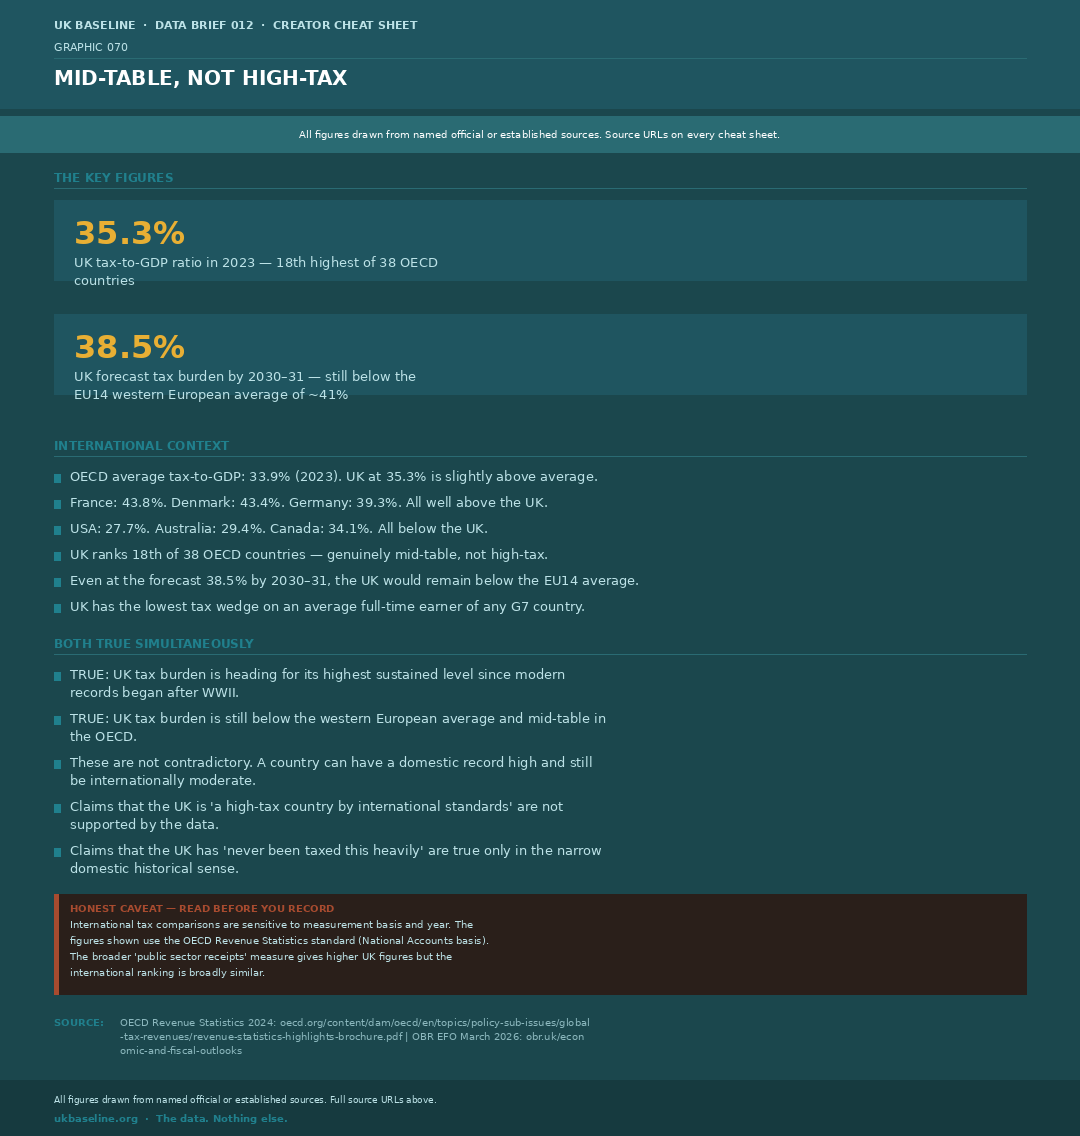
The UK's tax-to-GDP ratio was 35.3% in 2023, ranking 18th of 38 OECD countries — slightly above the OECD average of 33.9% but well below France (43.8%), Denmark (43.4%), and the EU14 western European average of around 41%. Even the forecast 38.5% by 2030–31 would leave the UK below the current European average.
- UK has the lowest tax wedge on an average earner of any G7 country
- UK's top income tax rate (45%) is the lowest among Europe's five largest economies
- Both of these are true simultaneously: UK at a domestic post-war high and internationally mid-table
- Claims that Britain is "a high-tax country" or "never been taxed this heavily" require careful qualification
- Source: OECD Revenue Statistics 2024; OBR EFO March 2026
Read Before You Record
The headline numbers are robust, but their definition and denominator matter. Keep these three qualifications with any retelling of the brief.
- All income tax distribution figures cover taxpayers only — around 43% of UK adults paid no income tax (IFS estimate, 2014–15). The population base matters when making comparisons.
- There are two measures of the tax burden in common use: National Accounts taxes (~38.5% by 2031) and public sector current receipts (~42.7%). Both show the same trend. Always specify which you are citing.
- The VAT regressivity question is a genuine methodological dispute between ONS (regressive against income) and IFS (neutral against expenditure). Neither is simply wrong. Present both framings.
Sources
The full source list below links to the underlying official data and supporting analysis used in this brief.
- HMRC Table 2.4 — Shares of total Income Tax liability
- HMRC Income Tax Liabilities Statistics 2024–25
- OBR Economic and Fiscal Outlook March 2026
- OBR 300 Years of UK Public Finance Data
- ONS Effects of Taxes and Benefits FYE 2024
- IFS — Tax system reduces inequality but benefits do most of the heavy lifting
- IFS — One in five taxpayers paying higher-rate tax by 2027
- OECD Revenue Statistics 2024
- House of Commons Library — Tax statistics: an overview (CBP-8513)