Youth Unemployment
Youth unemployment at 16.4% is near an 11-year high — and that framing dominates the political conversation. What it omits is that the same rate was 21.4% in 2011, and 840,000 young people being NEET is almost exactly where we were in 2015. The genuinely new thing in this data is not the headline rate but what it costs an employer to hire a young person: total employer cost for a full-time NLW worker has risen 63% since 2019, with the April 2025 National Insurance change adding a further structural shift. Hospitality — which employs a disproportionate share of young workers — shed 79,000 jobs in a single year. Six graphics. The data only.
The Rate in Context
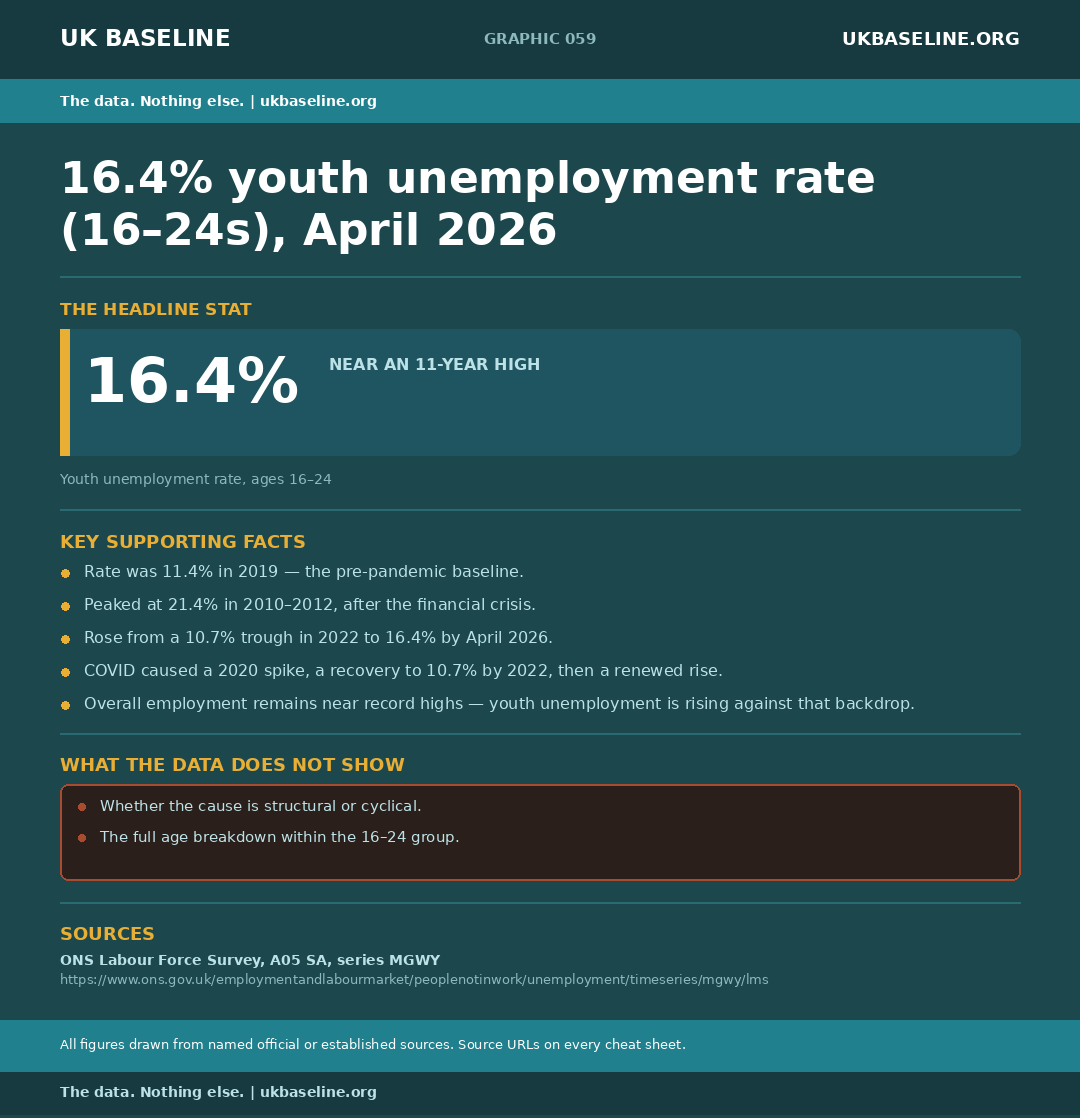
Youth unemployment among 16–24s stood at 16.4% in April 2026 — near an 11-year high. The same rate peaked at 21.4% in 2010–2012 as the post-financial-crisis recession fed through into reduced hiring and graduate recruitment. It then fell steadily to a trough of 10.7% in 2022 before rising again. COVID caused a temporary spike in 2020, followed by a sharp recovery, meaning the current rise is a distinct post-pandemic trend rather than a direct COVID effect.
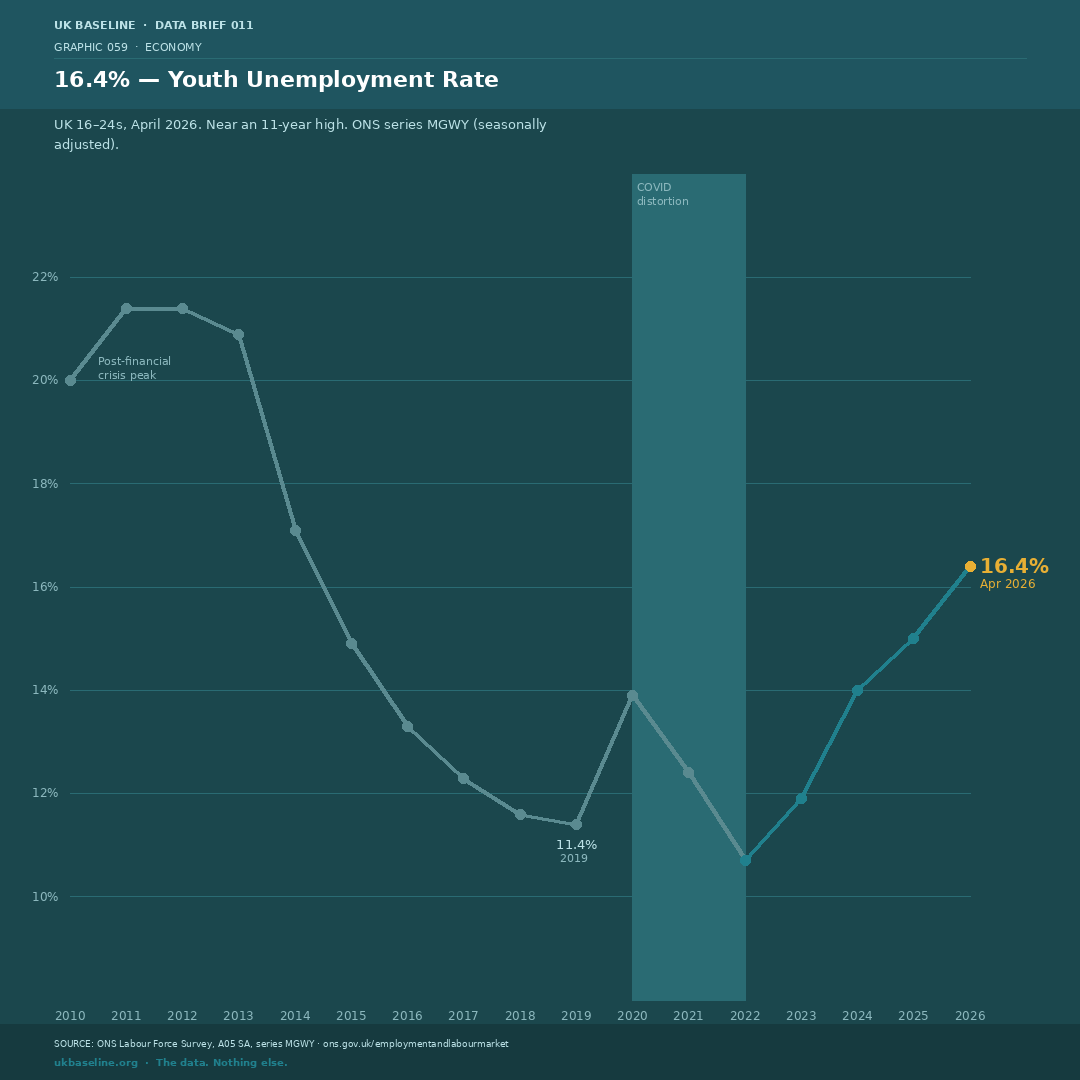
ONS series MGWY from the Labour Force Survey (A05, seasonally adjusted). The 16–24 age group includes full-time students who say they are looking for work — this inflates the rate compared with adult measures. The rate measures those without a job who are actively seeking one, as a share of the economically active in that age group.
Immigration vs Youth Jobs
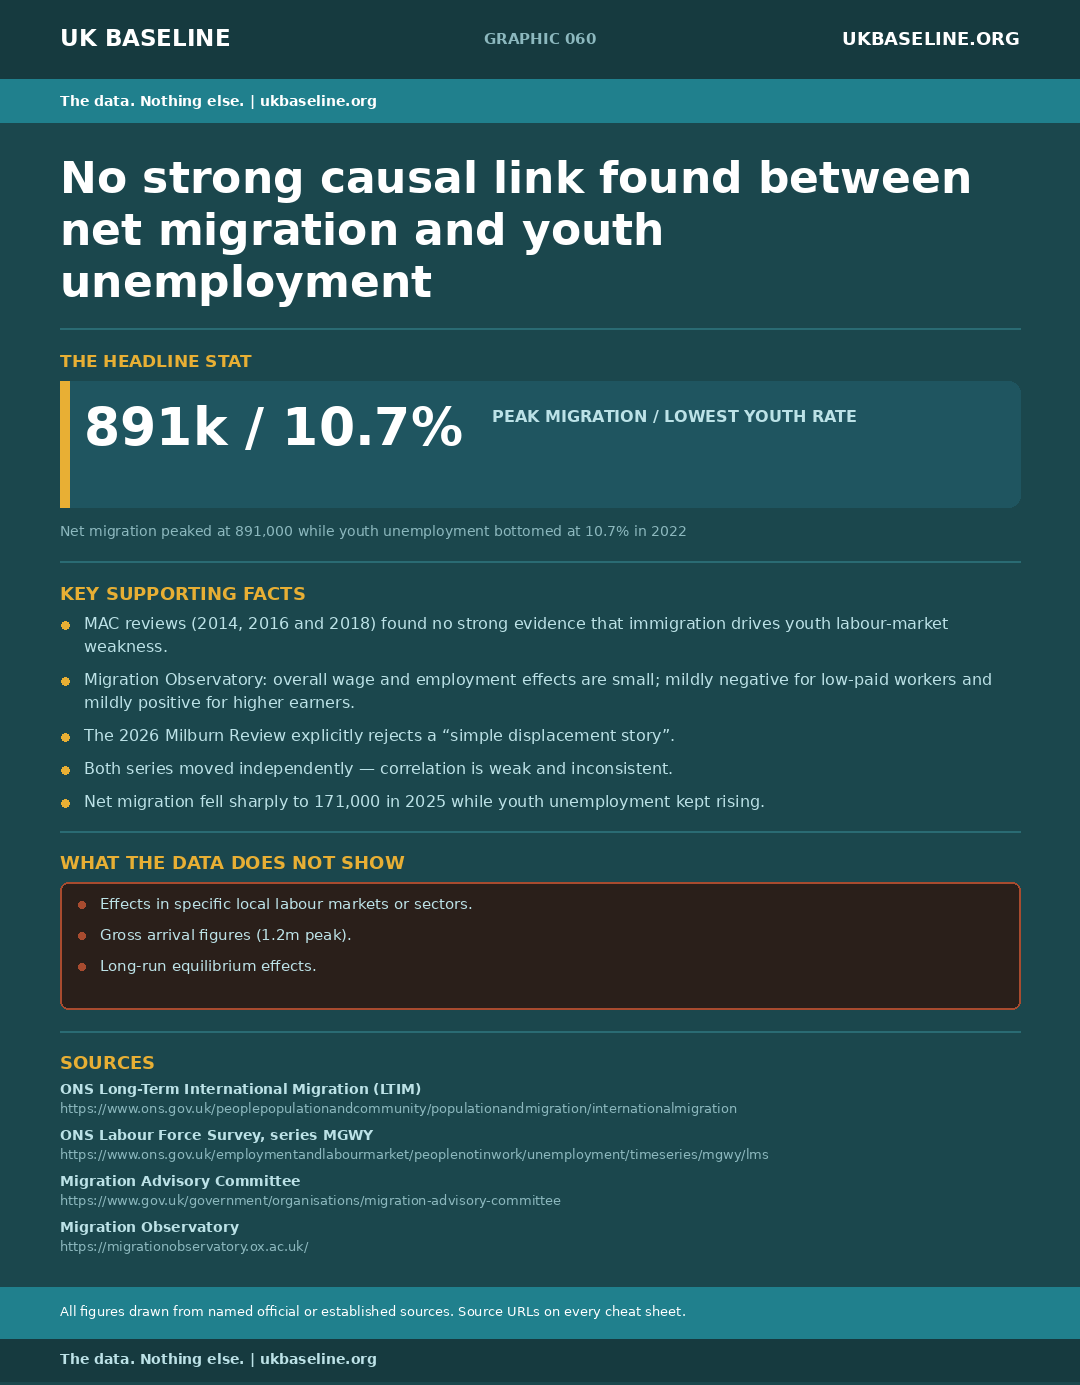
Net migration and youth unemployment have moved largely independently since 2012. Net migration peaked at 891,000 in the year ending December 2022 — the same year youth unemployment hit its lowest point (10.7%). Since then net migration has fallen sharply to around 171,000 in 2025 while youth unemployment has risen. The Migration Advisory Committee, Migration Observatory, and the 2026 Milburn Review all find no strong causal link between immigration levels and youth labour market outcomes.
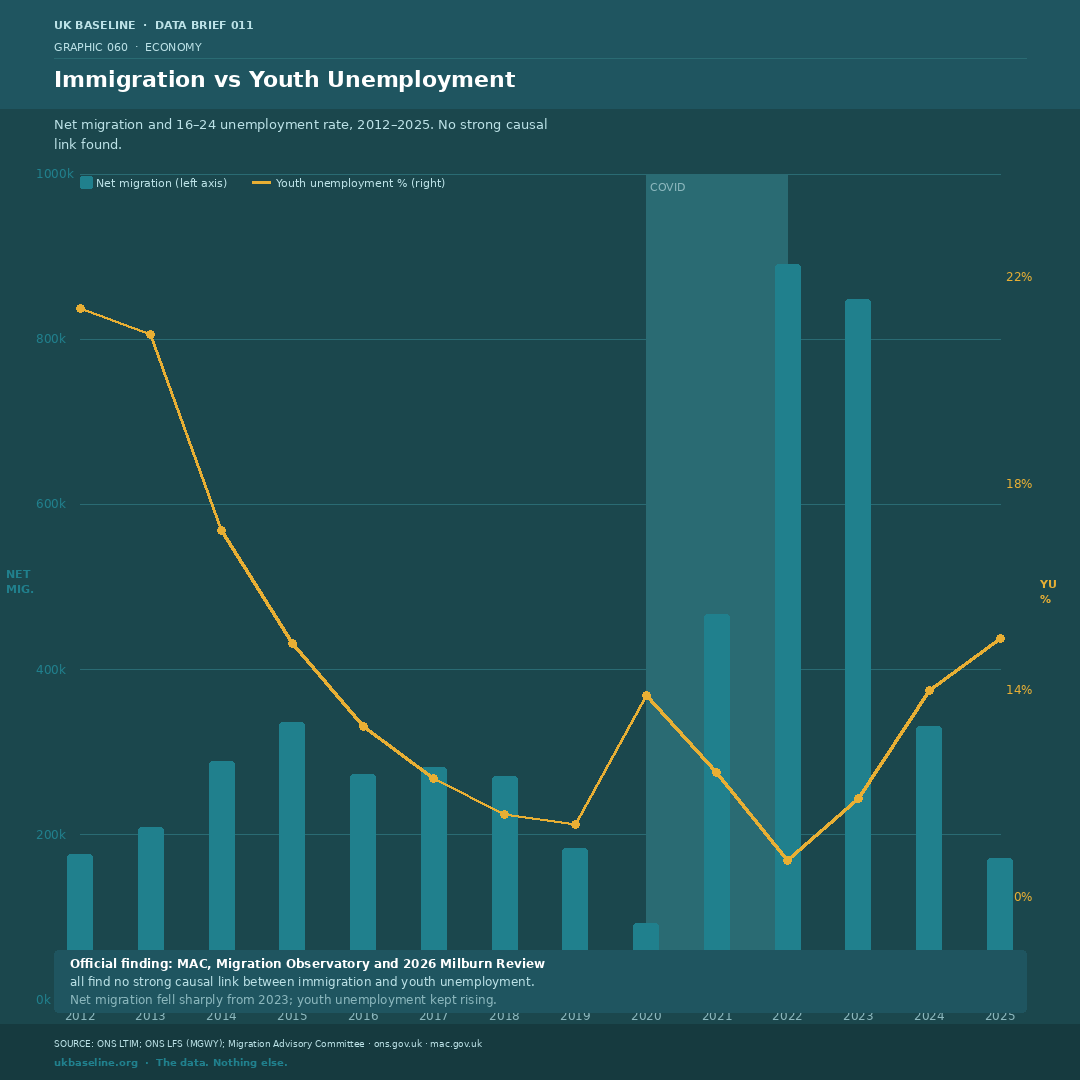
Net migration figures from ONS Long-Term International Migration (LTIM) revised series, which uses administrative data following the 2024 methodology change. Gross immigration peaked at around 1.2 million in the year to June 2023 — net migration is lower because departures (including British nationals leaving) offset arrivals. Both measures are valid; they answer different questions.
The Cost of Hiring
Employing one full-time worker on the National Living Wage now costs £27,752 per year in gross wage and employer National Insurance alone — up 63% from £17,028 in 2019. The NLW itself rose from £8.21 to £12.71 per hour over that period. The April 2025 National Insurance change — rate raised from 13.8% to 15%, threshold cut from £9,100 to £5,000 — added approximately £800 per full-time worker on top of an already significant wage increase. The NLW applies to workers aged 21 and over; those aged 16–20 earn the lower National Minimum Wage (£10.00 per hour in 2026).
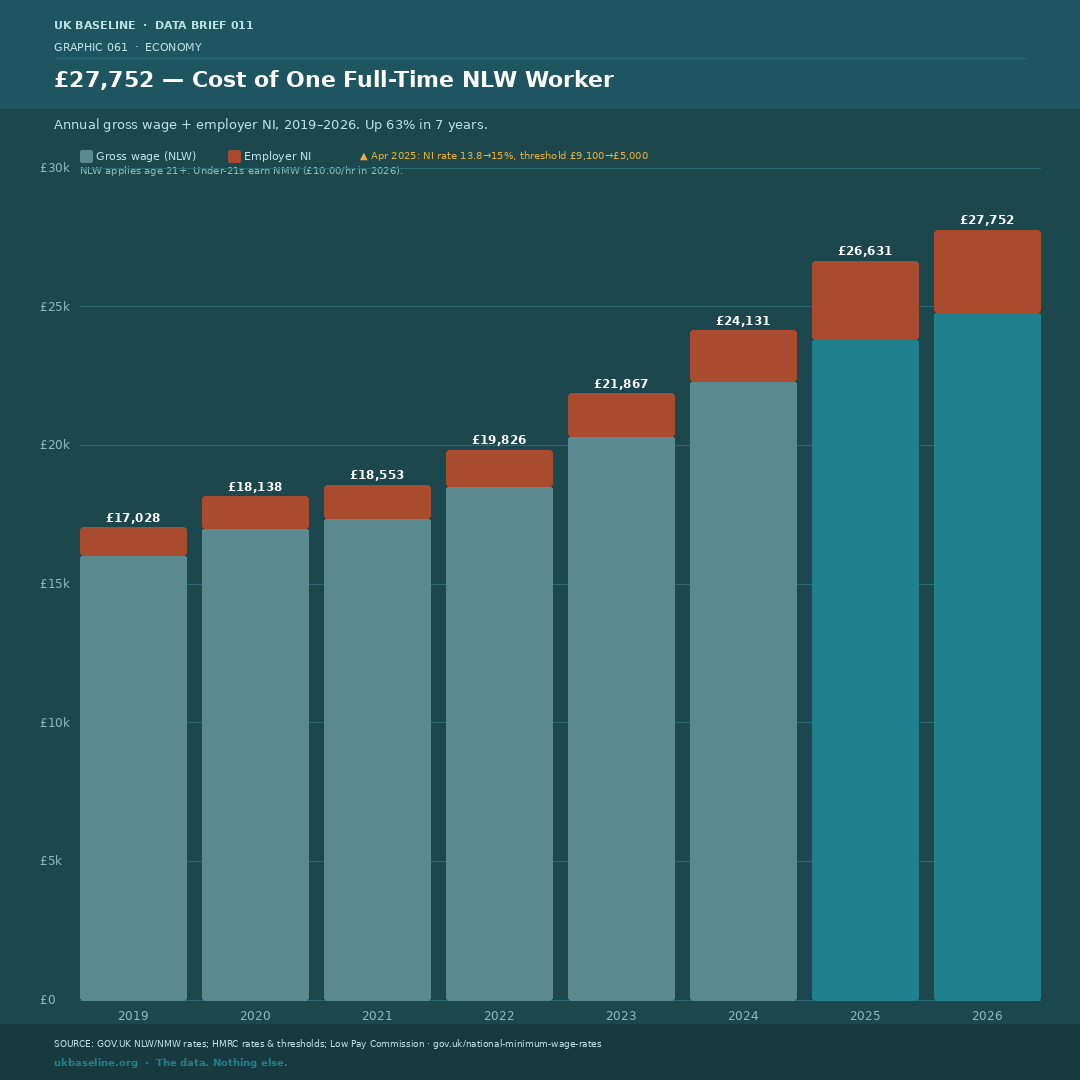
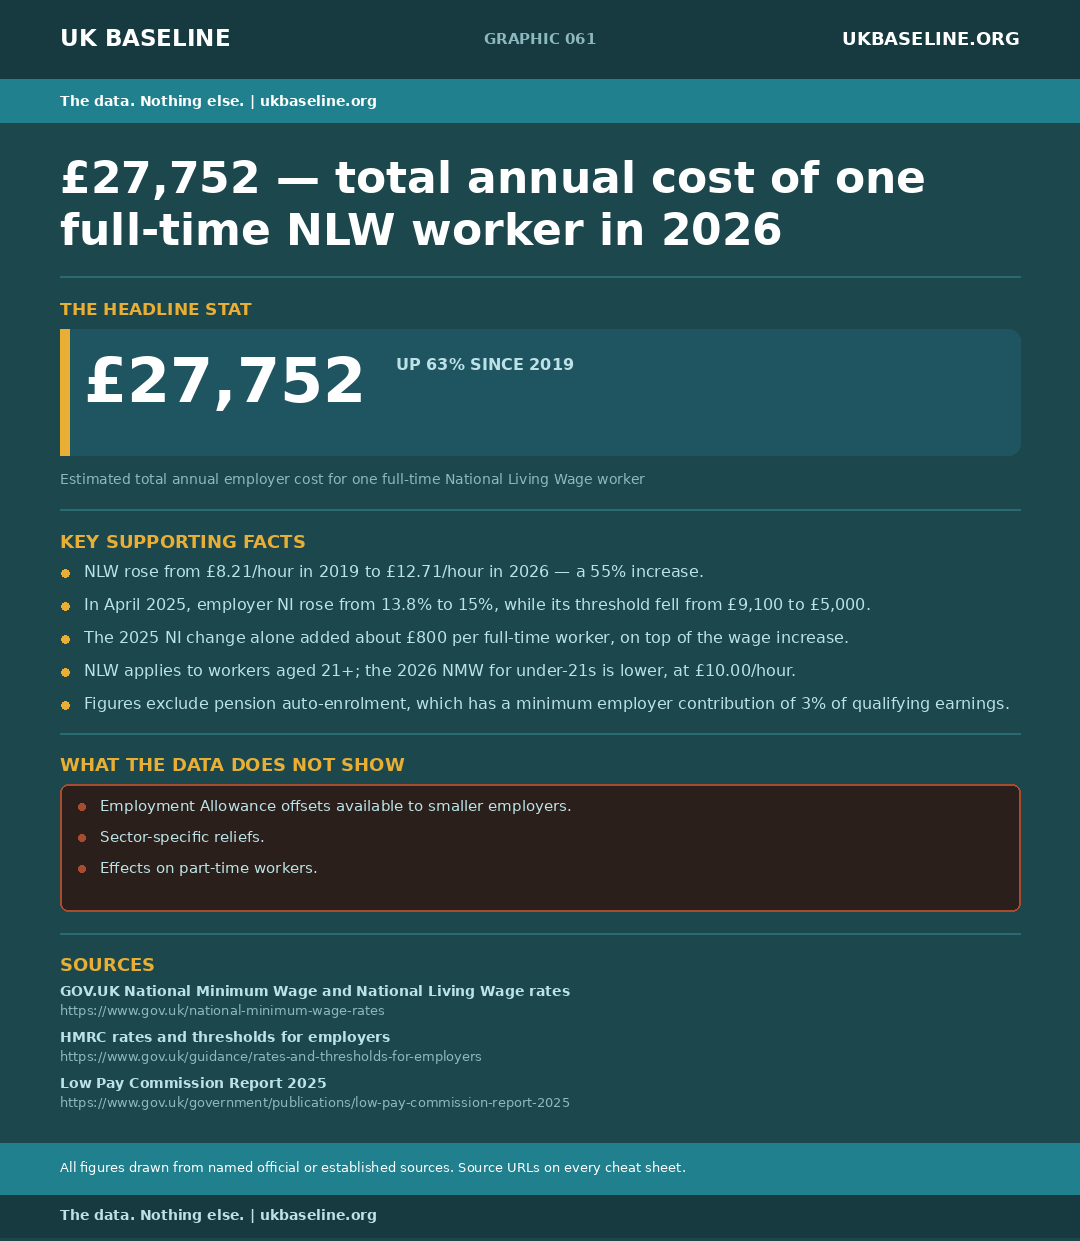
Figures assume a 37.5-hour working week, 52 weeks. Excludes pension auto-enrolment (minimum 3% of qualifying earnings, which adds roughly £600–700 per year at NLW). Employment Allowance allows eligible smaller employers to offset up to £10,500 of their employer NI bill annually from April 2025.
Inactive — But Not Unemployed
Around 40% of 16–24s are economically inactive — meaning they are neither employed nor actively seeking work. This figure sounds alarming but is largely stable: it has fluctuated between 38% and 41% since 2019. The largest reason for inactivity in this age group is full-time education (approximately 50%), followed by family or caring responsibilities (around 20%). What has changed is the long-term sickness subcategory: 3.0% of all 16–24s were classified as long-term or temporarily sick in 2025, up from 1.8% in 2019 — a 67% relative rise, and the fastest-growing inactivity reason in this age group.
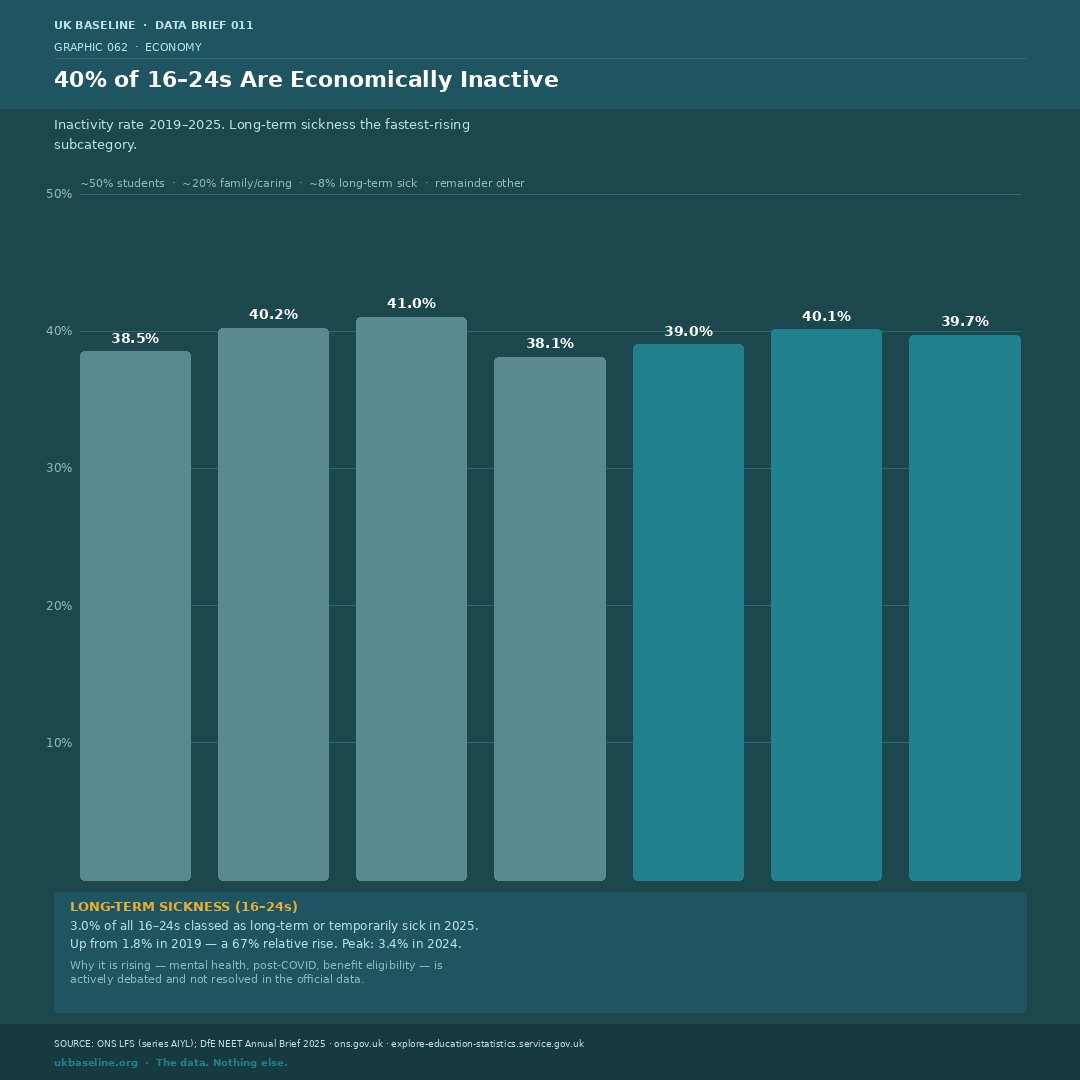
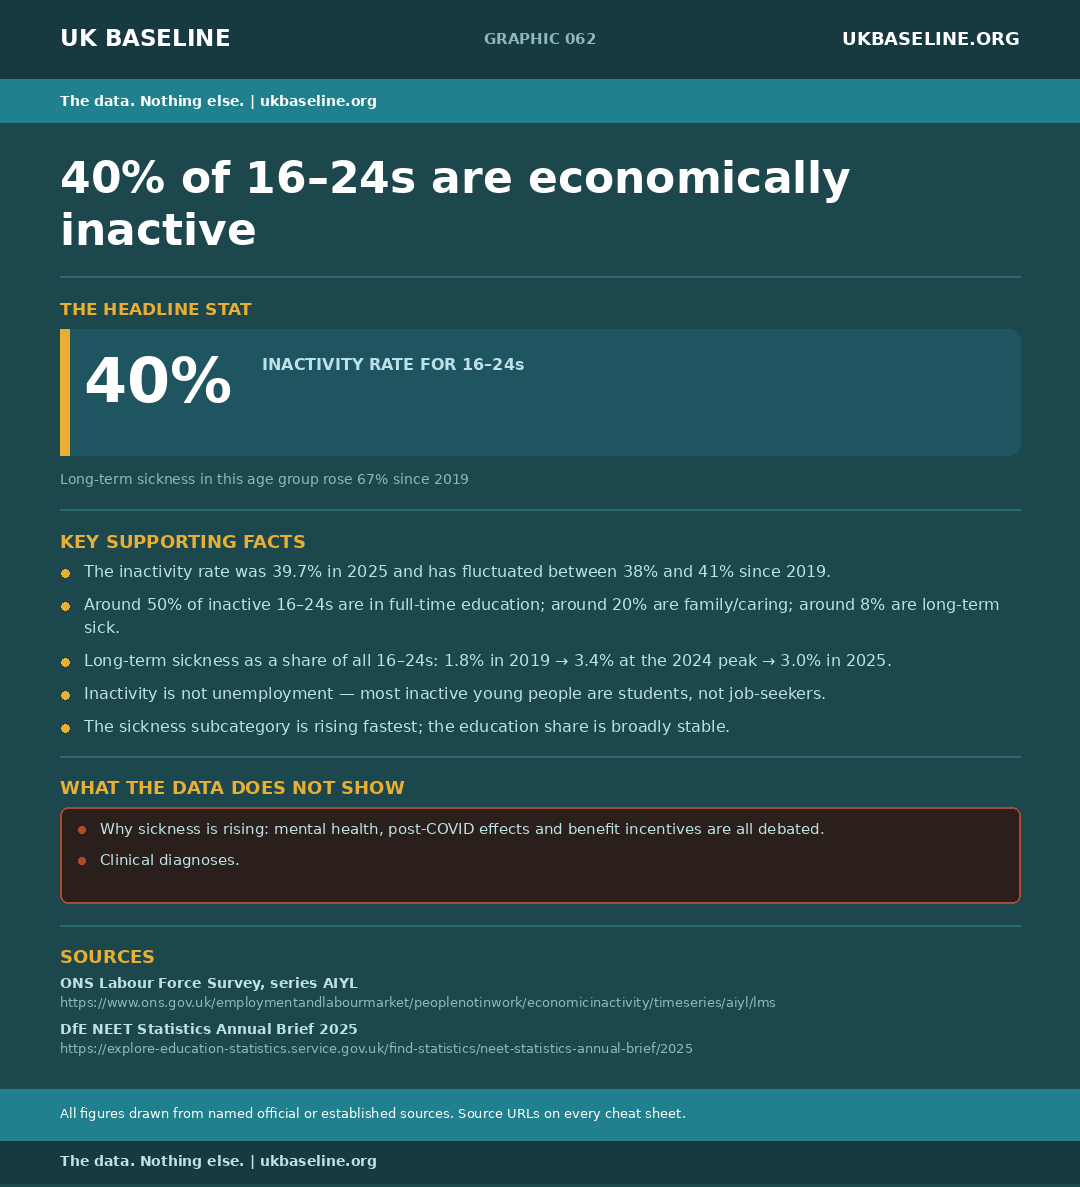
Economic inactivity series AIYL from ONS Labour Force Survey. Long-term sickness figures from DfE NEET Annual Brief 2025 and ONS ad hoc releases — the precise definitions differ slightly between sources and are not directly comparable to clinical diagnoses. The reasons for the sickness rise (mental health, post-COVID conditions, benefit eligibility changes) are actively debated and not resolved in the official data.
NEET: 840,000 Young People
839,900 young people aged 16–24 were not in education, employment or training (NEET) in England in October–December 2025 — a rate of 13.3%. Looking back to 2010 puts this in context: NEET numbers peaked at around 1.05 million (16.7%) in the aftermath of the financial crisis, fell steadily to 730,000 (11.9%) by 2022, and have since risen back to near 840,000. The current level is comparable to 2015. The 18–24 sub-group has seen the sharpest rise, with its NEET rate up from 13.0% in 2019 to 16.0% in 2025.
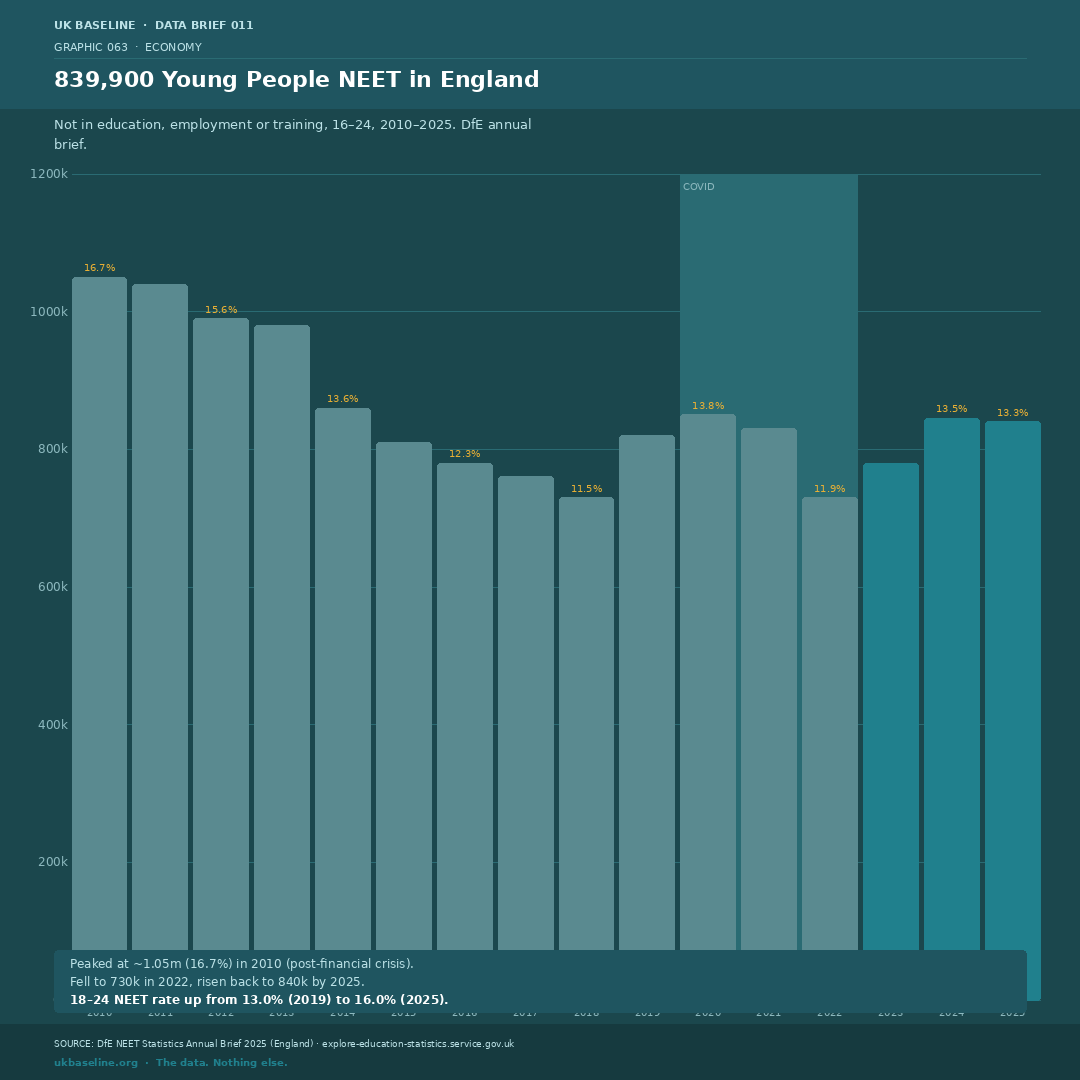
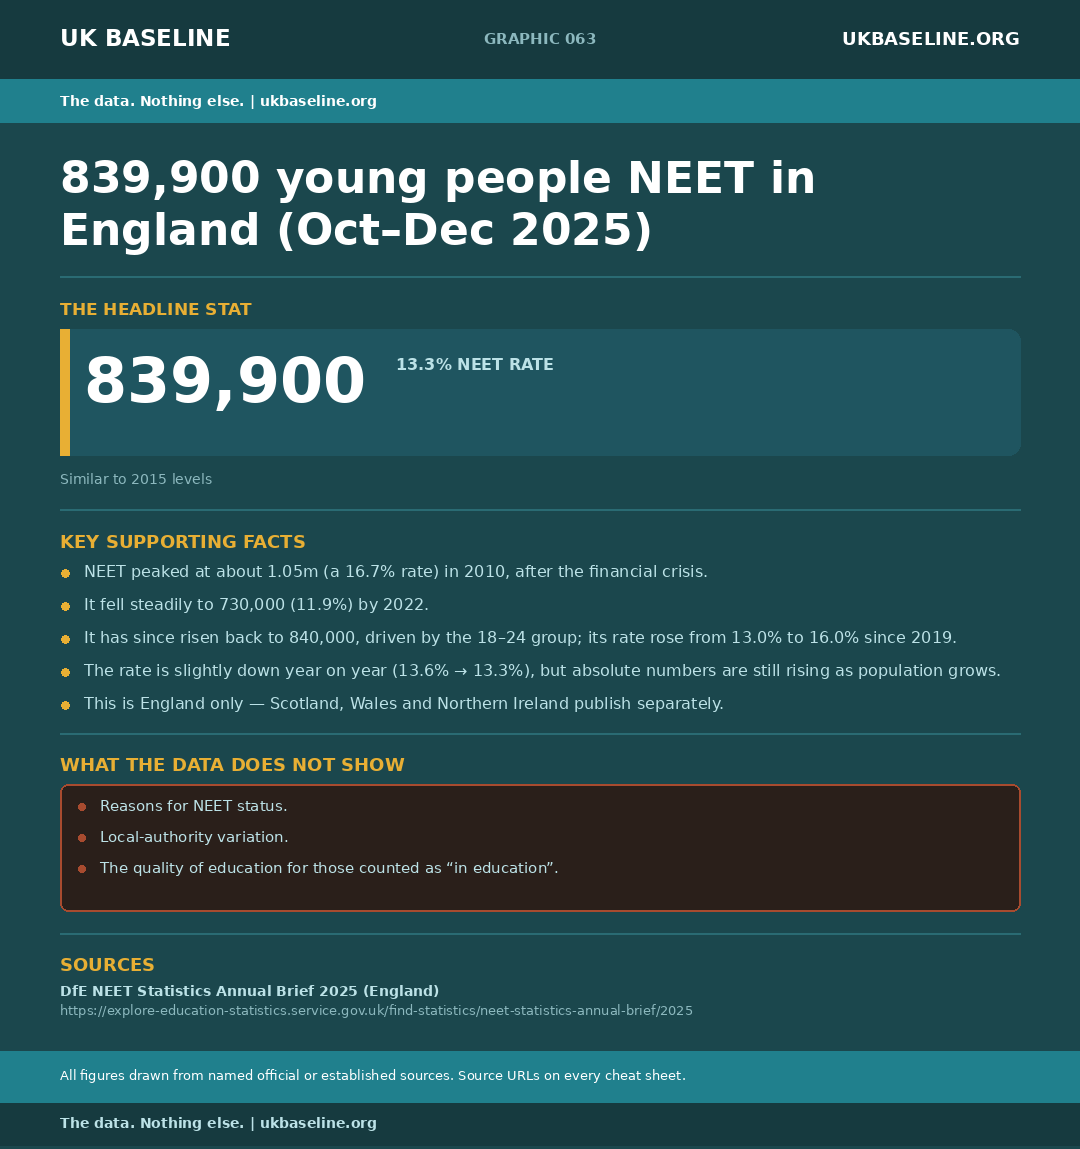
England only. Scotland, Wales and Northern Ireland publish NEET data separately with different methodologies, making UK-wide comparisons imprecise. DfE NEET Annual Brief uses the Labour Force Survey for 16–24 figures. The NEET rate is not the same as the unemployment rate: it includes economically inactive young people who are not in education, which the unemployment rate does not.
Where the Jobs Are Going
Hospitality shed 79,000 jobs in the year to June 2026 — the largest single-sector fall of any UK industry that year. Retail employment has also declined steadily, from around 2,928,000 in 2019 to approximately 2,790,000 in 2025. Both sectors employ a disproportionately high share of young workers. The Low Pay Commission's 2025 report found that employers in hospitality and retail responded to rising wage costs primarily by reducing hours and cutting recruitment rather than large-scale redundancies — meaning the impact on young workers is likely understated by headline employment figures alone.
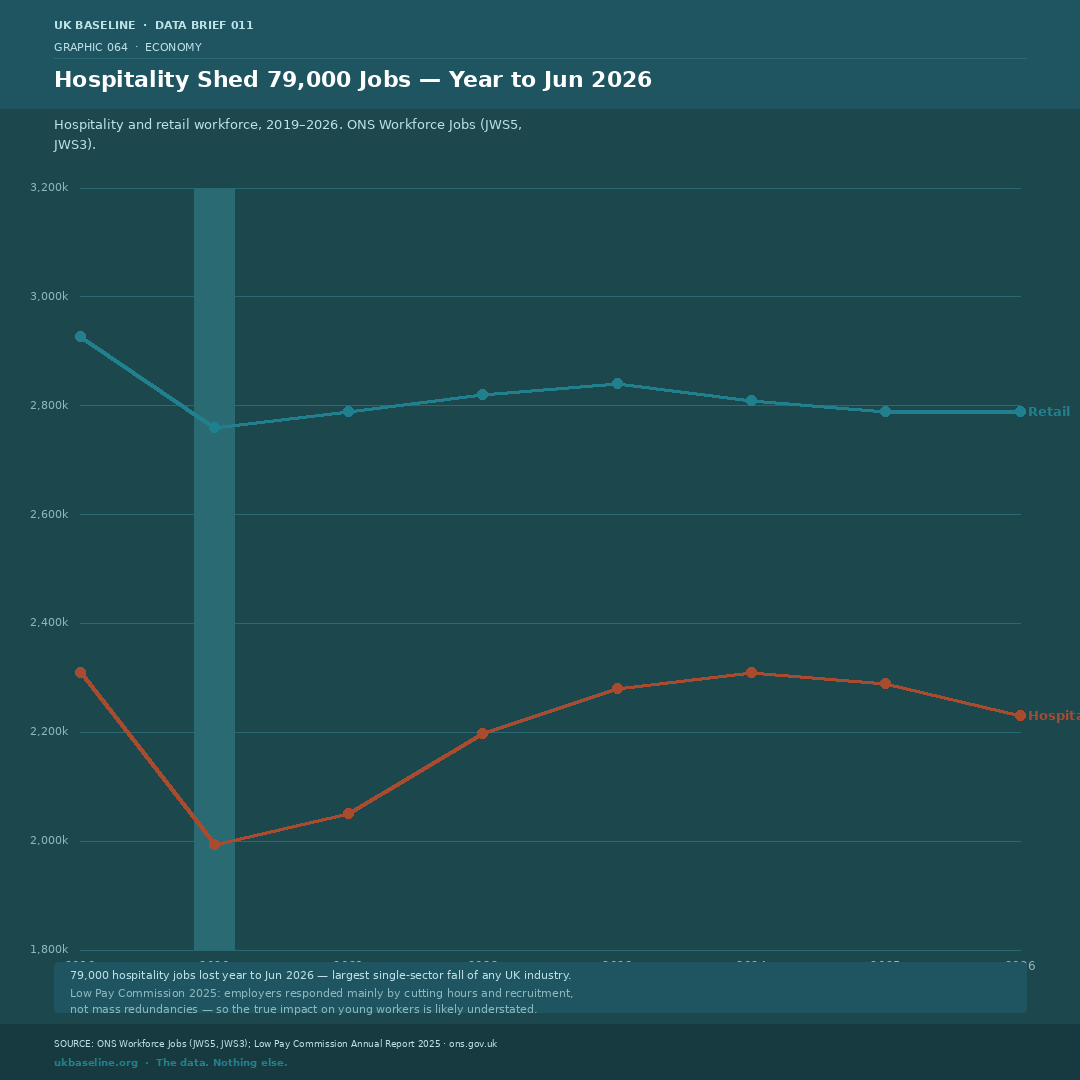
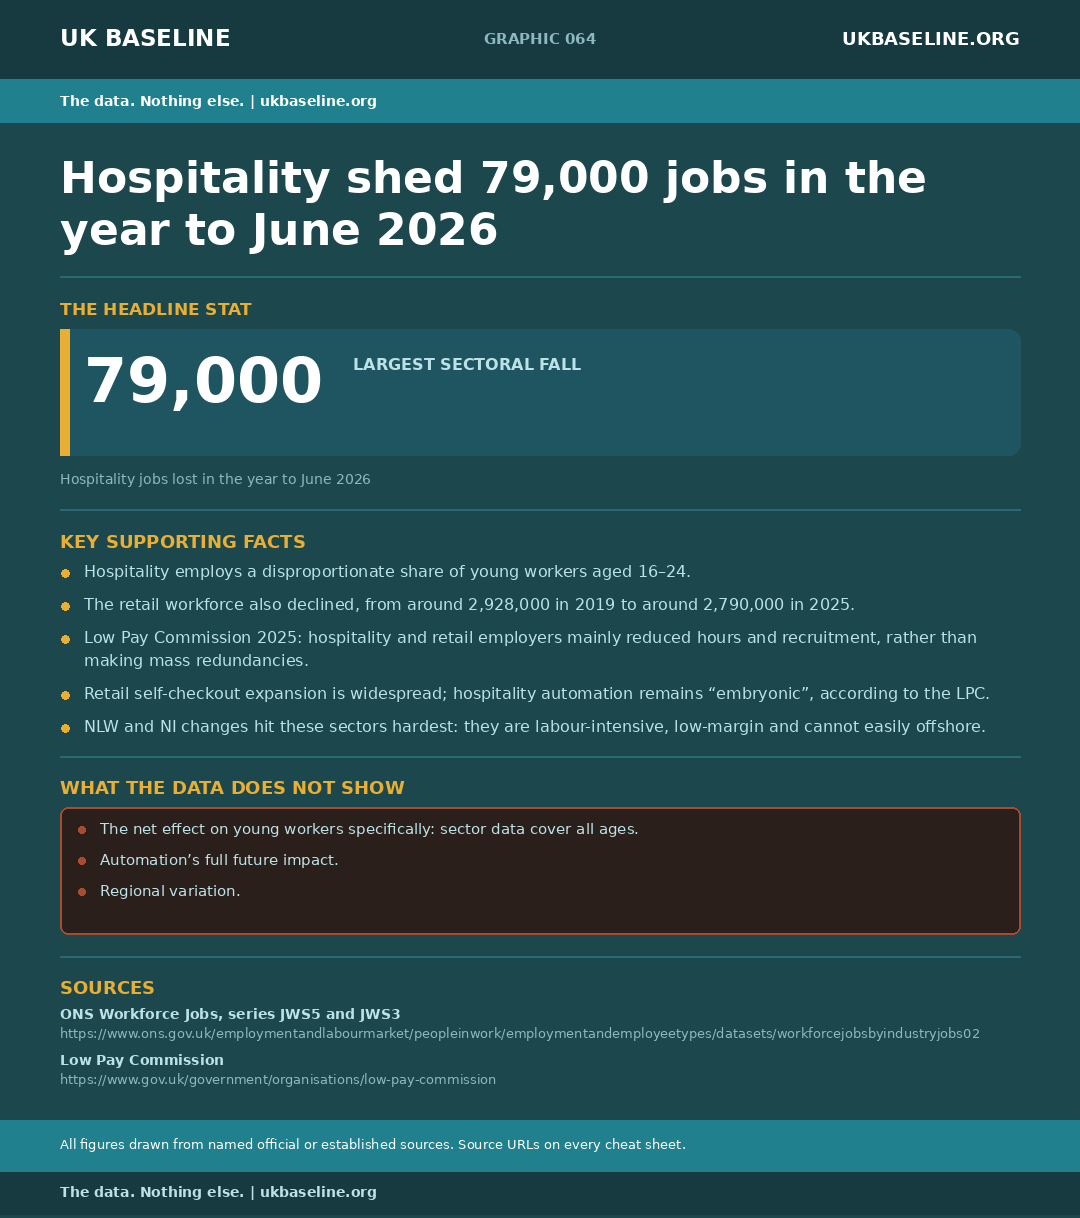
ONS Workforce Jobs series JWS5 (hospitality, SIC Section I) and JWS3 (retail, SIC Section G). Data covers all ages — no young-worker breakdown is available at sector level from this series. The 79,000 hospitality figure is for the year to June 2026; figures are subject to revision. Low Pay Commission findings from Annual Report 2025 (gov.uk/government/organisations/low-pay-commission).