Fuel Prices
The pump price of petrol is one of the most politically charged numbers in British life — yet it is almost entirely determined by two things most politicians cannot control: crude oil prices and the exchange rate. Fuel duty, frozen since 2011 and cut in 2022, is at its lowest real-terms level since the early 1990s. What has changed is retailer margins, which the CMA found had more than doubled since 2019. Five graphics. The data only.
The Price You Pay
Petrol cost 150p per litre in July 2026 — up from 101p in 2010, with a peak of 192p in July 2022. Crude oil is the primary driver: when Brent crude rose sharply after the Ukraine invasion, pump prices followed within weeks. The two move in close lockstep on a per-litre basis.
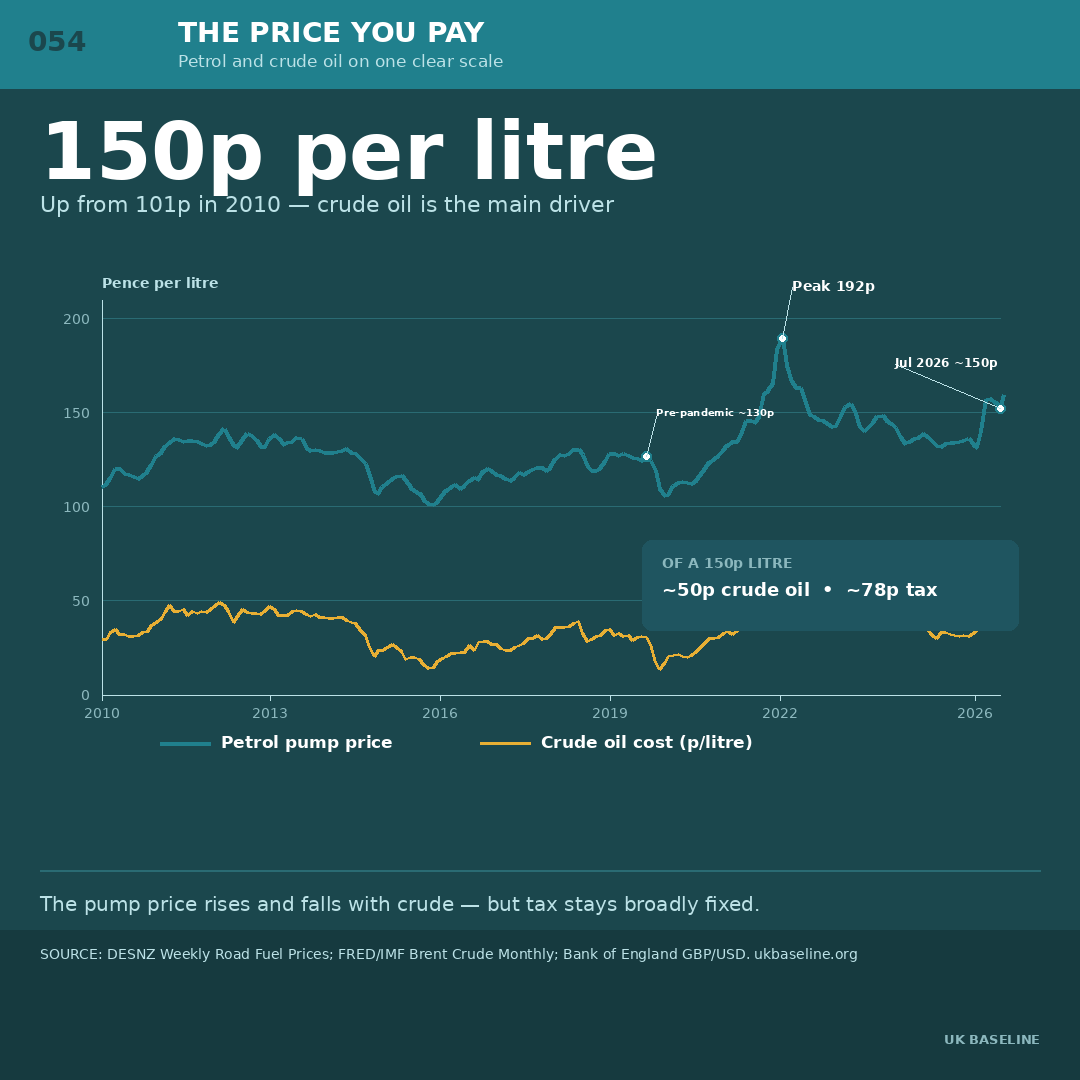
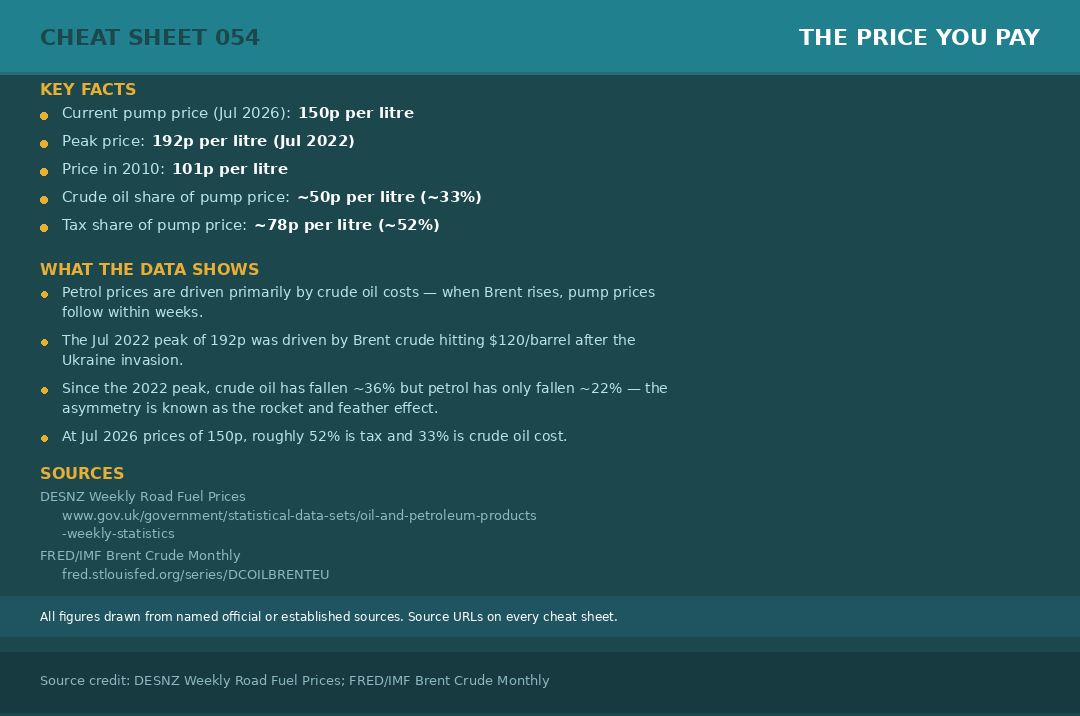
Crude oil prices converted from USD per barrel using monthly average GBP/USD exchange rate (Bank of England). Brent crude is a global benchmark; actual crude purchased by UK refiners may differ.
What's in a Litre
At 150p per litre, roughly 78p is tax — 52.95p in fuel duty plus around 25p in VAT. That is 52% of the pump price. Pre-tax cost (crude oil, refining, and retail margin combined) accounts for the remaining 72p. Tax as a share of the pump price is lower when prices are high, because duty is fixed in pence per litre while VAT rises proportionally.
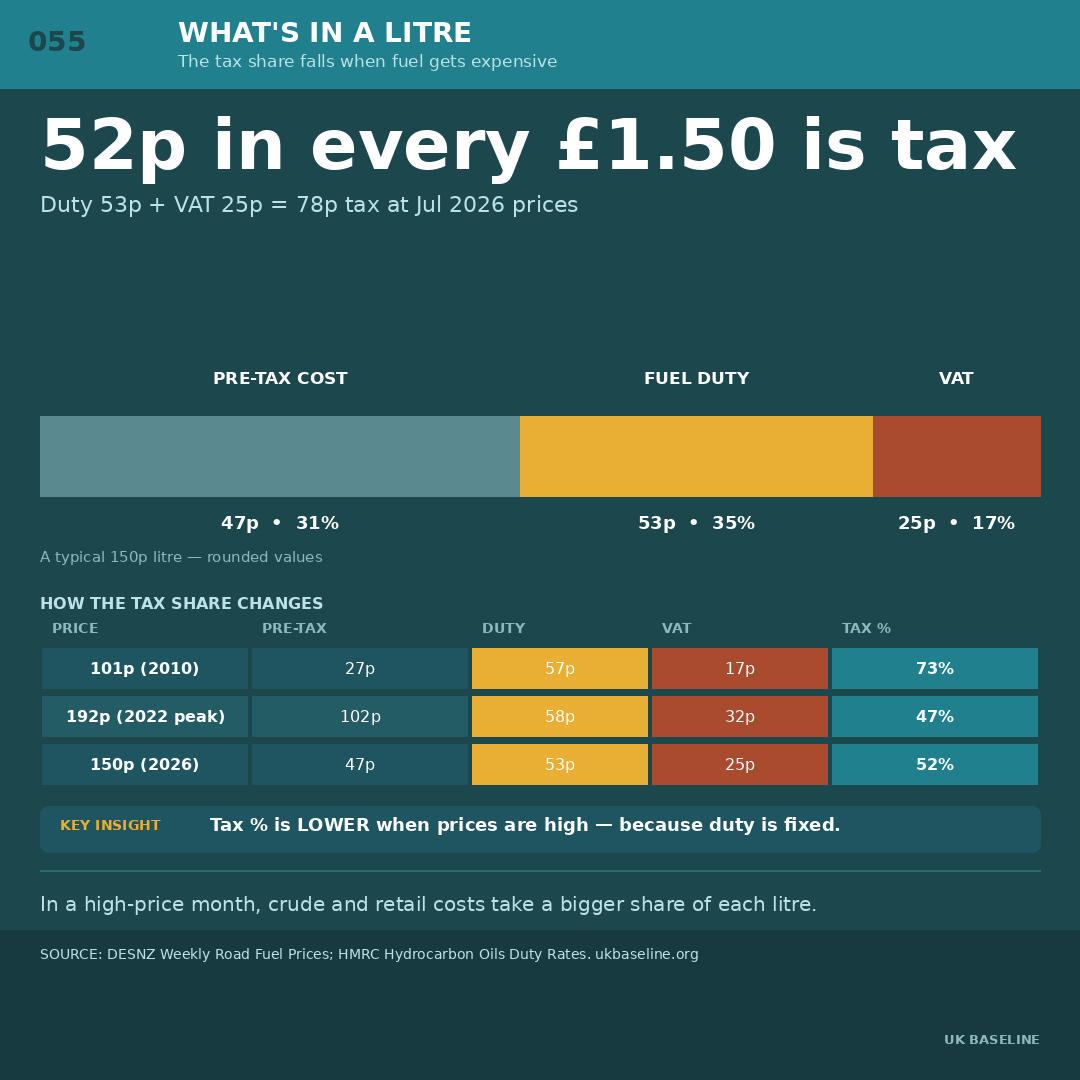
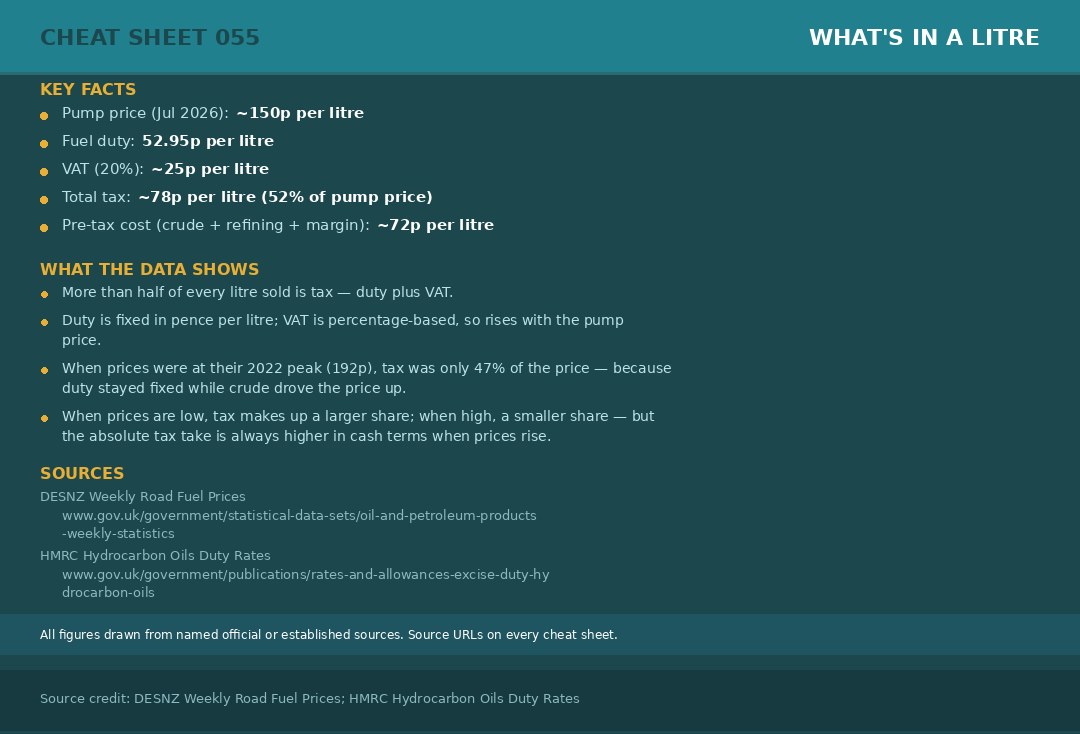
VAT calculated at 20% of pump price inclusive. Pre-tax cost is a residual — it includes crude oil, refining, transport, and retailer margin combined, not just crude.
The Tax That Didn't Rise
Fuel duty stands at 52.95p per litre — lower in cash terms than the 57.95p rate that held from 2011 to 2022, and at its lowest real-terms level since the early 1990s. The rate was frozen for 11 years, then cut by 5p in March 2022 in response to the Ukraine-driven price spike. A rise to 55.95p is planned from January 2027.
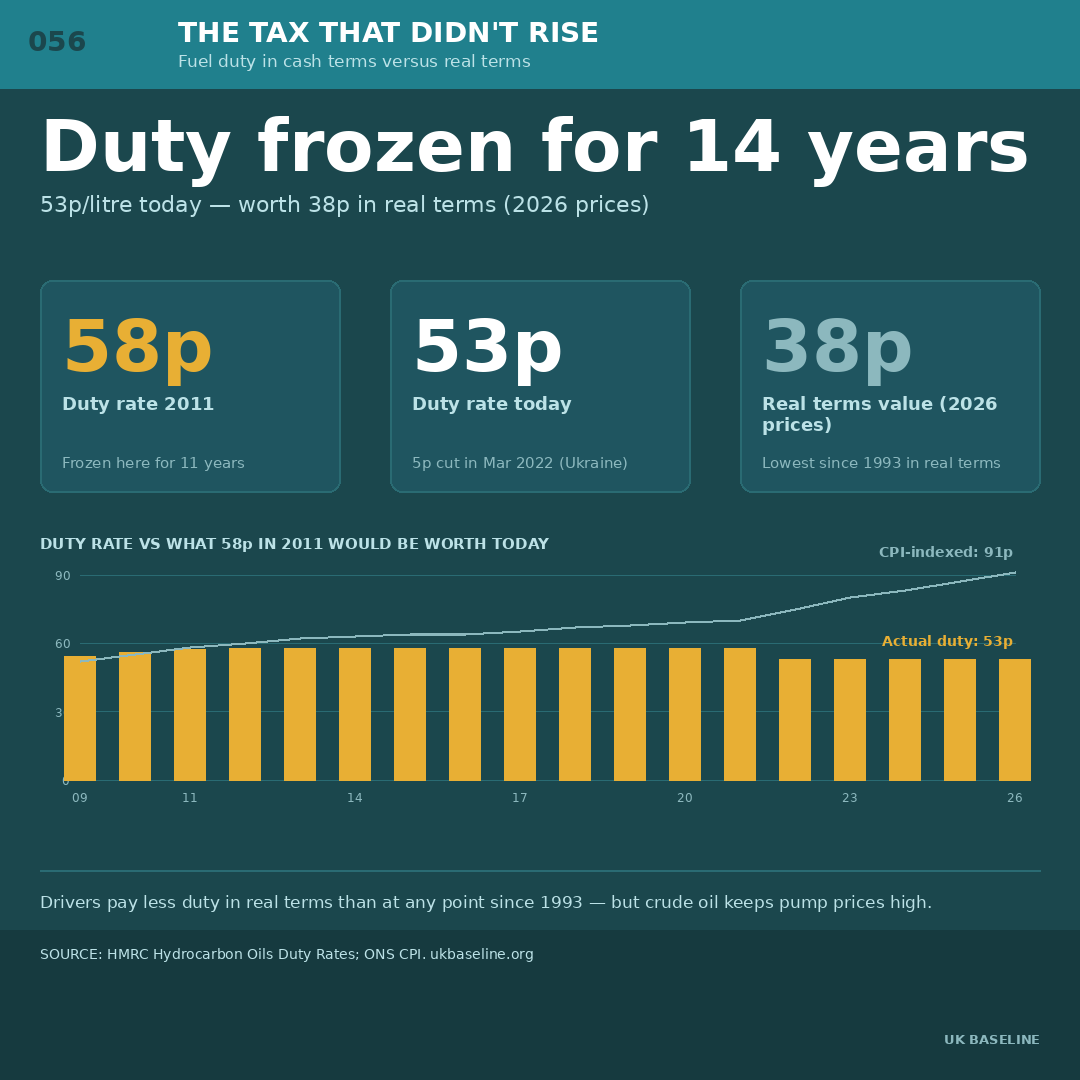
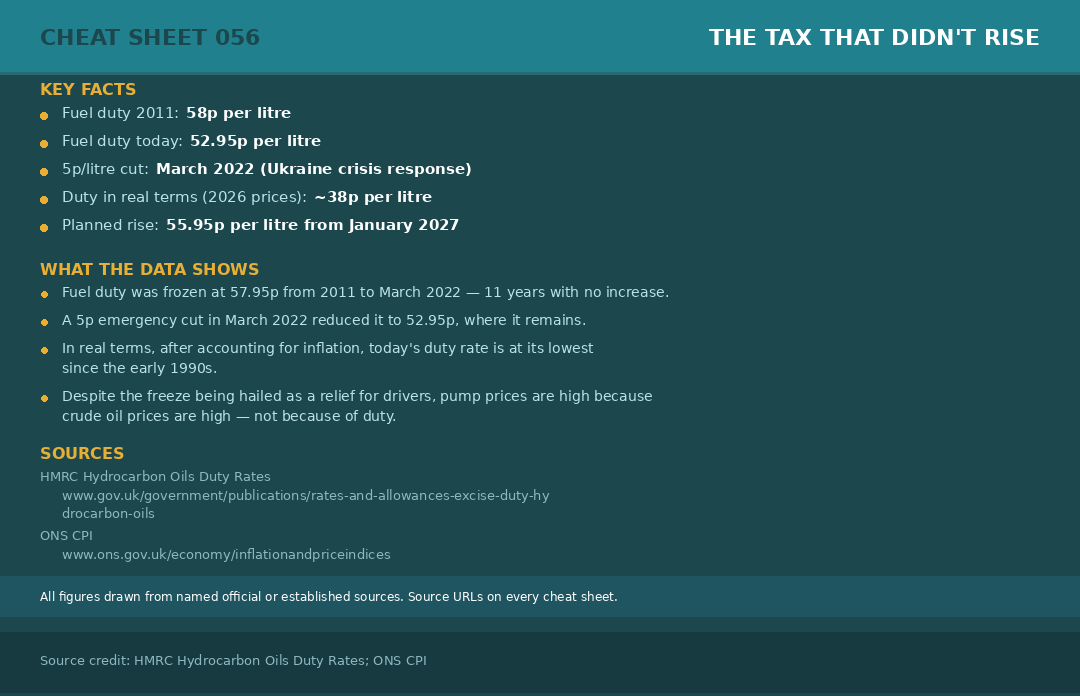
Real-terms calculation uses ONS CPI, rebased to 2026. Planned January 2027 rise to 55.95p is subject to Budget confirmation — check latest HMRC guidance before citing.
The Widening Margin
Supermarket fuel retailer margins averaged around 4p per litre in 2019. By 2023 they had risen to 10.9p — a figure the CMA calculated cost UK drivers an estimated £1.6 billion more than they would have paid at pre-pandemic margins. By 2025 supermarket margins had eased to 9.6p, but remain well above pre-pandemic levels.
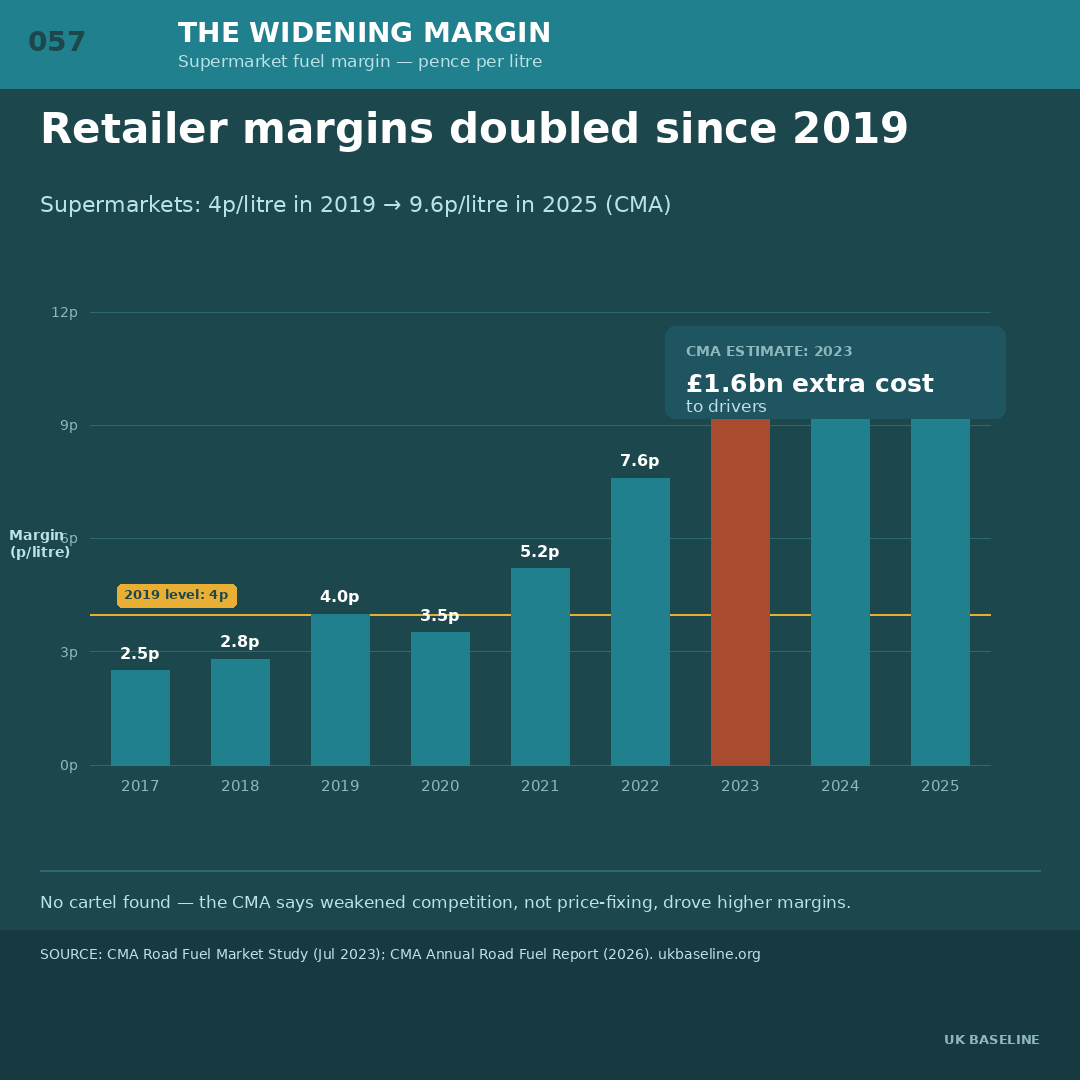
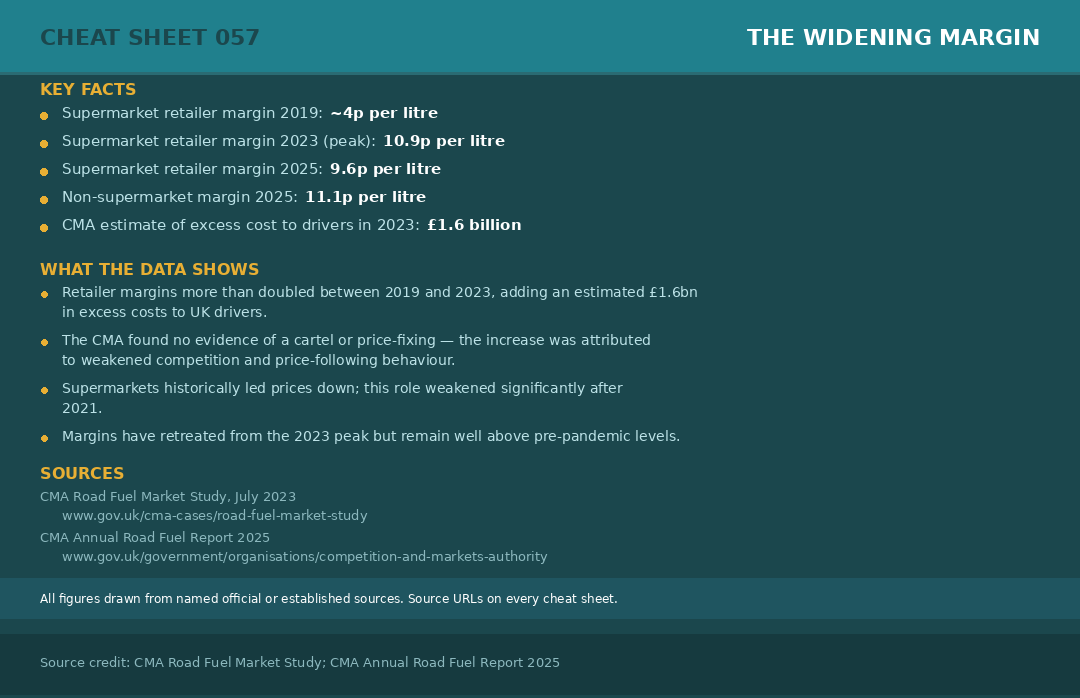
Margin data from CMA Road Fuel Market Study (2023) and CMA Annual Road Fuel Report (2025/26). Margin defined as pump price minus wholesale cost. Non-supermarket margins are higher — 11.1p per litre in 2025 — but data series is less complete.
Rocket and Feather
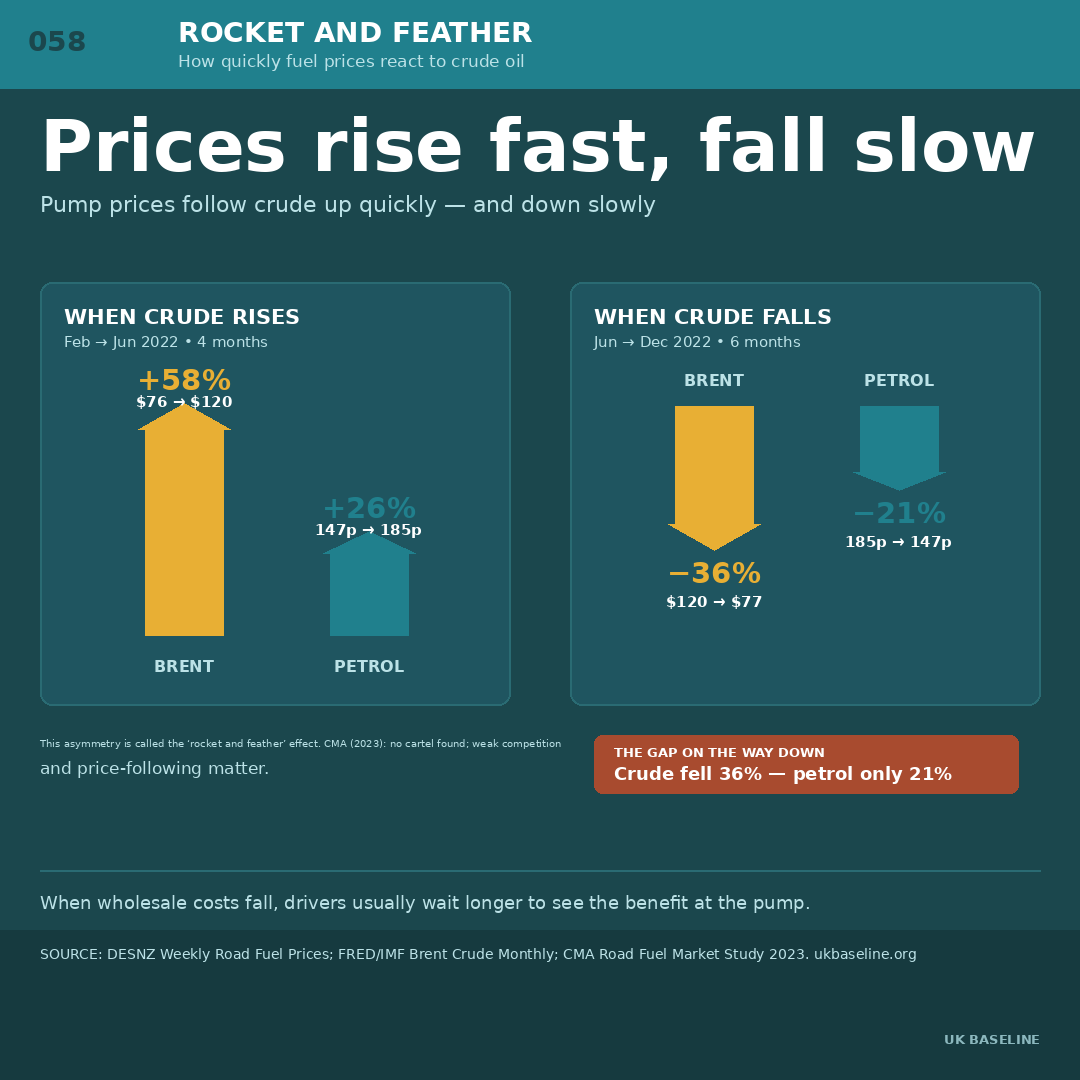
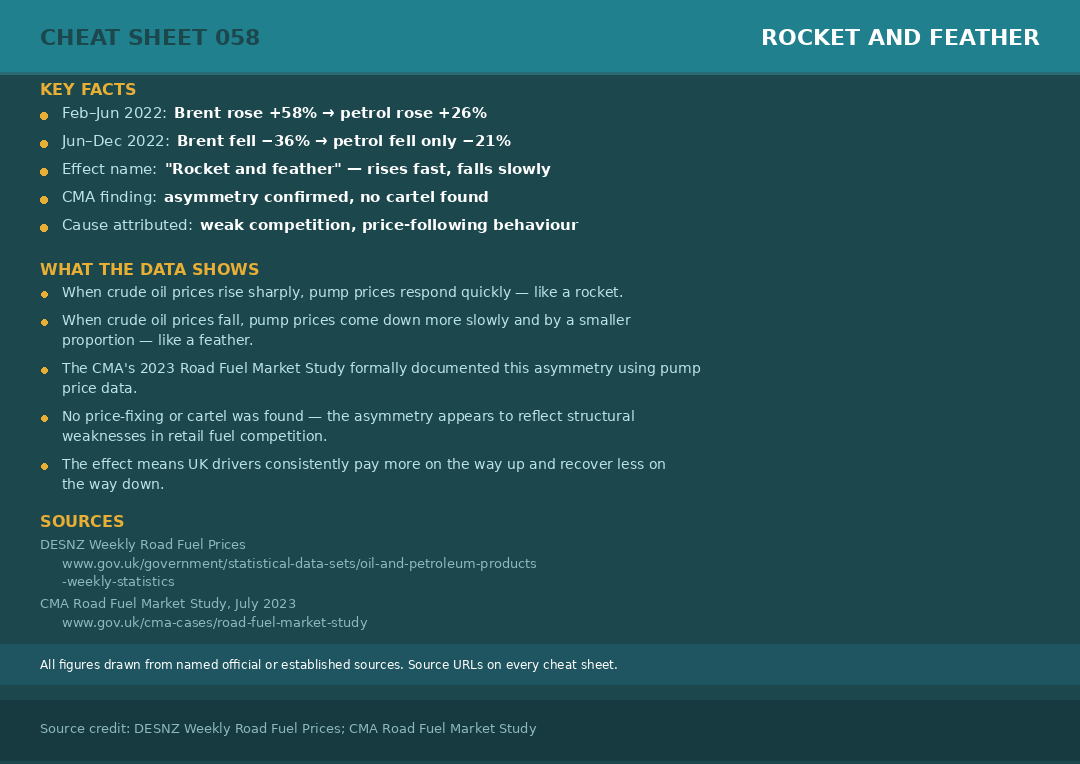
UK petrol prices rise faster than they fall. When Brent crude surged 58% between February and June 2022, petrol prices rose 26%. When crude fell 36% between June and December 2022, petrol prices fell only 21%. The CMA formally documented this asymmetry — prices go up like a rocket and come down like a feather. No cartel was found; the effect was attributed to weakened retail competition.
Episode data from DESNZ weekly pump prices and FRED Brent monthly averages. The CMA's 2023 study covers England, Scotland, and Wales. The rocket and feather effect is a well-documented phenomenon in fuel markets globally — not unique to the UK.