NHS Waiting Lists & Productivity
The NHS is routinely deployed as a political weapon by both sides. The left points to underfunding; the right points to productivity failure. The data shows both are partially right and both are incomplete. The waiting list stood at 7.28 million in May 2026 — down from a peak of 7.77 million but still 59% above pre-pandemic levels. The 4-hour A&E standard has not been met since July 2015 — under a Conservative government. NHS spending is above the OECD average; outcomes are below it on most measures. Seven graphics. The data only.
Every performance failure documented in this brief spans multiple governments. The 18-week RTT standard was last met sustainably in 2015/16 under a Conservative government. The A&E standard was last met in July 2015 under a Conservative government. The cancer 62-day standard was broadly unmet from 2014 to 2026 across Conservative and Labour administrations. Note: the standard's methodology changed in October 2023, making pre- and post-revision performance not directly comparable. The NHS productivity gap predates COVID. The UK spends above the OECD average on health and achieves below-average outcomes on most international measures. None of these facts support a single-party blame narrative. The structural problems are older and deeper than any one government.
The List That Never Shrinks
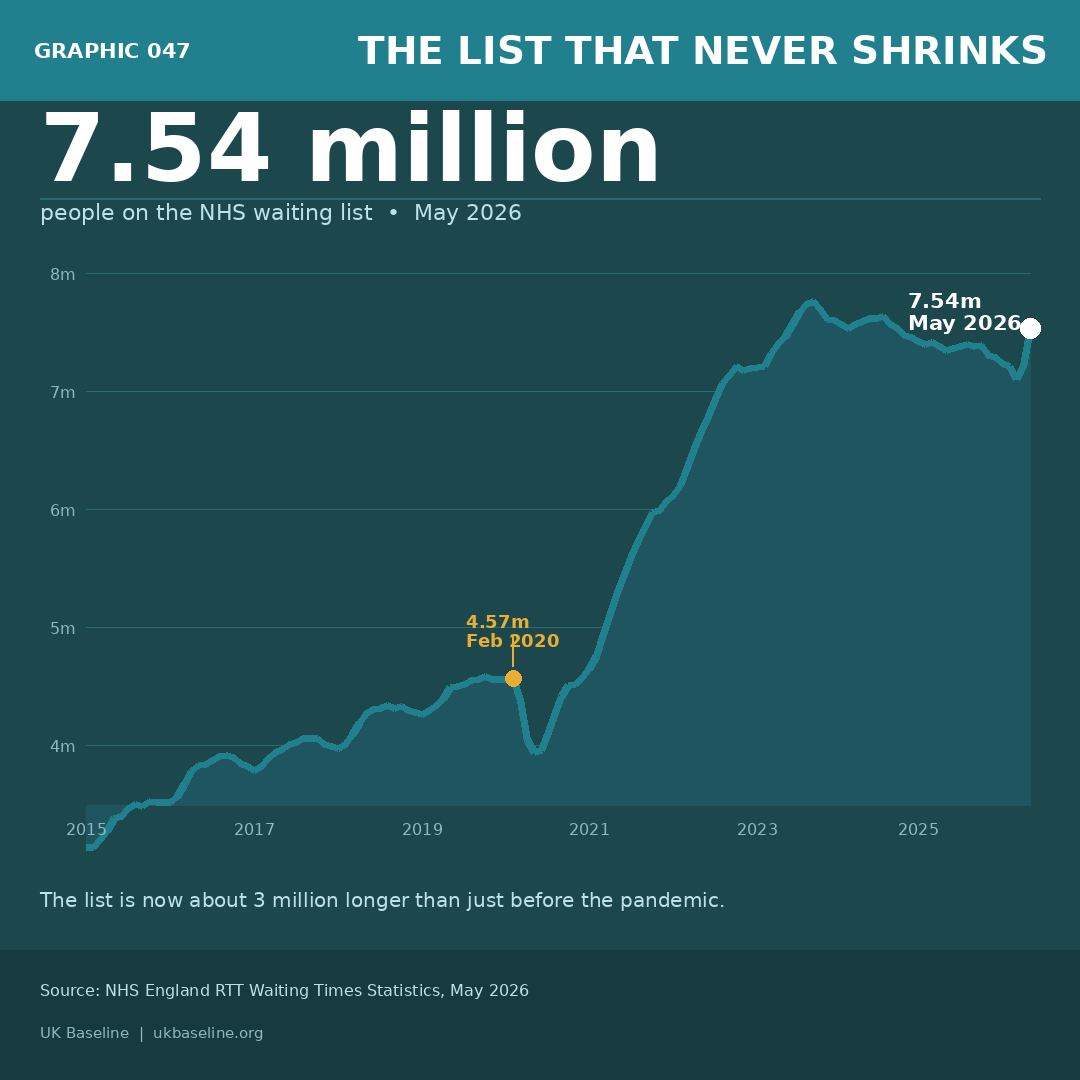
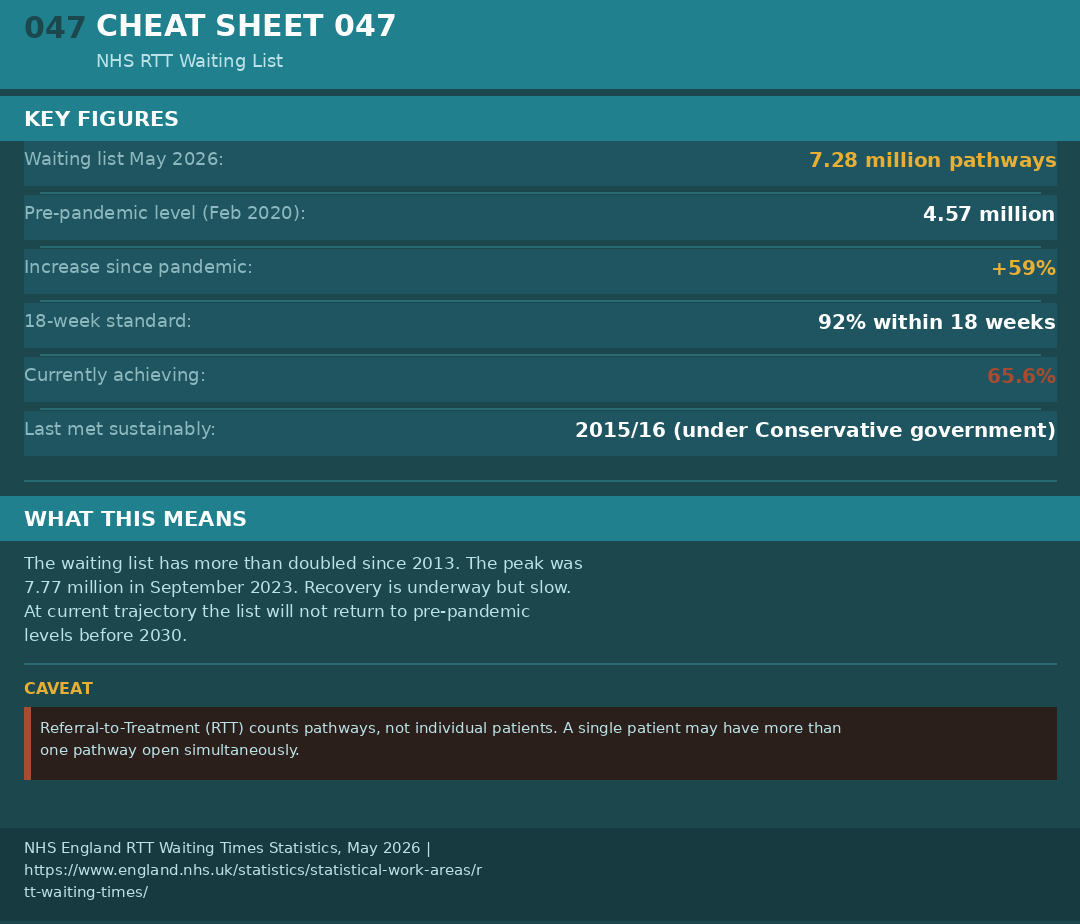
NHS referral-to-treatment (RTT) waiting list, England, April 2012 to May 2026. The list stood at 4.57 million before COVID in February 2020. It peaked at 7.77 million in September 2023 and had fallen to 7.28 million by May 2026 — still 59% above the pre-pandemic baseline. The 18-week standard (92% treated within 18 weeks) was last met sustainably in 2015/16. Current performance: 65.6%.
A Decade in the Wait
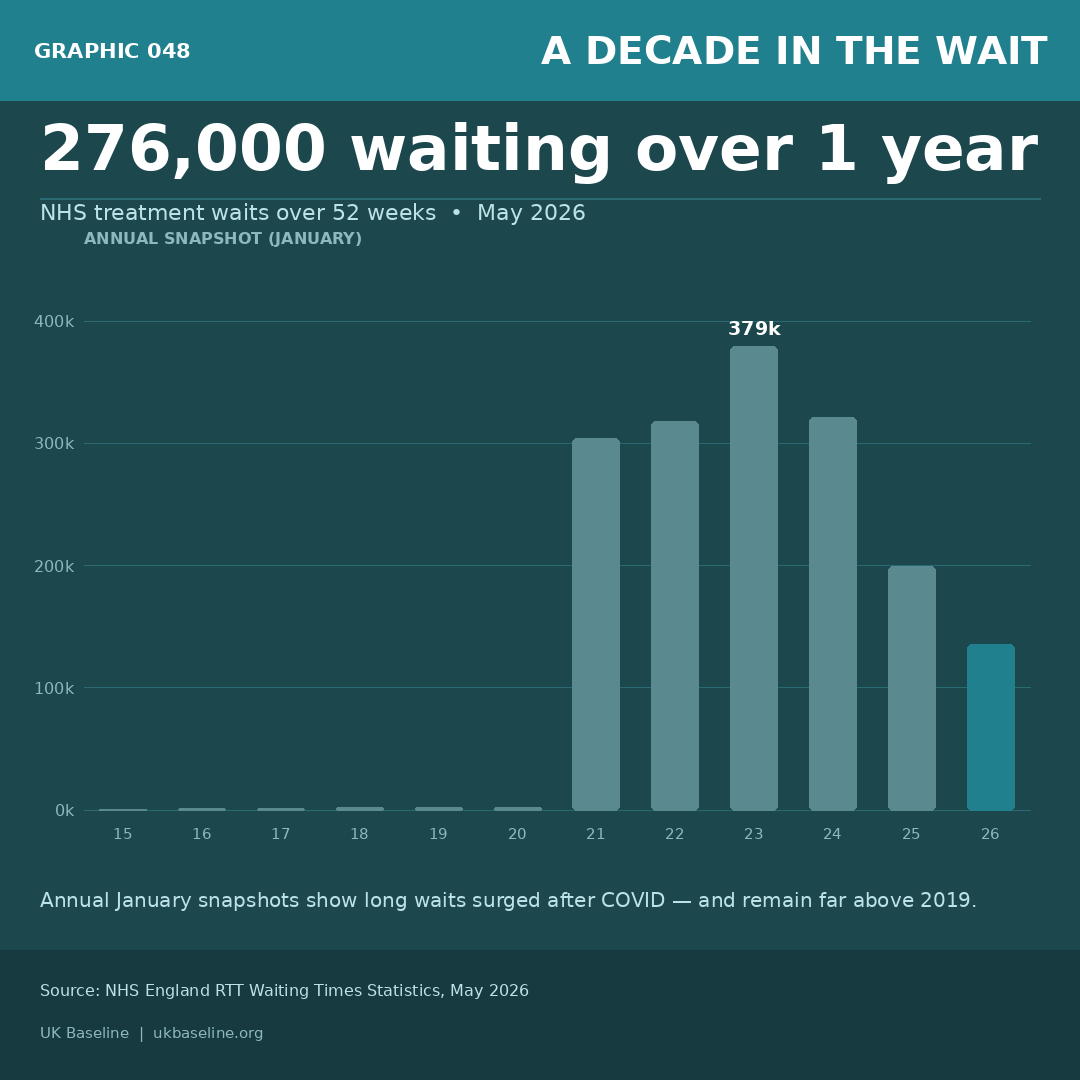
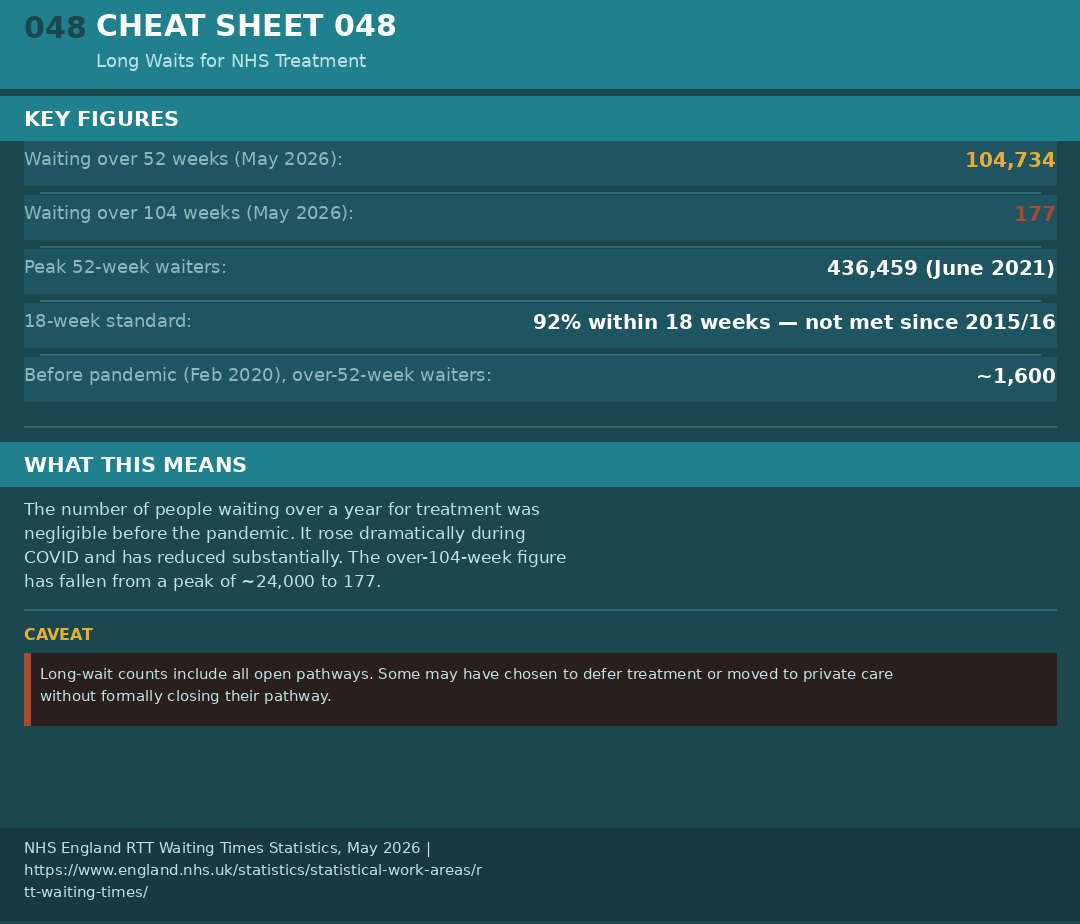
Patients waiting over 52 weeks, 65 weeks, and 104 weeks from referral to treatment, England, January 2019 to May 2026. In January 2019, fewer than 3,100 people waited over 52 weeks. By April 2021 that had risen to 436,127 — a 140-fold increase. As of May 2026: 104,734 waiting over 52 weeks, 6,740 over 65 weeks, 177 over 104 weeks. The pre-pandemic baseline has not been restored.
A&E: The Target Nobody Meets
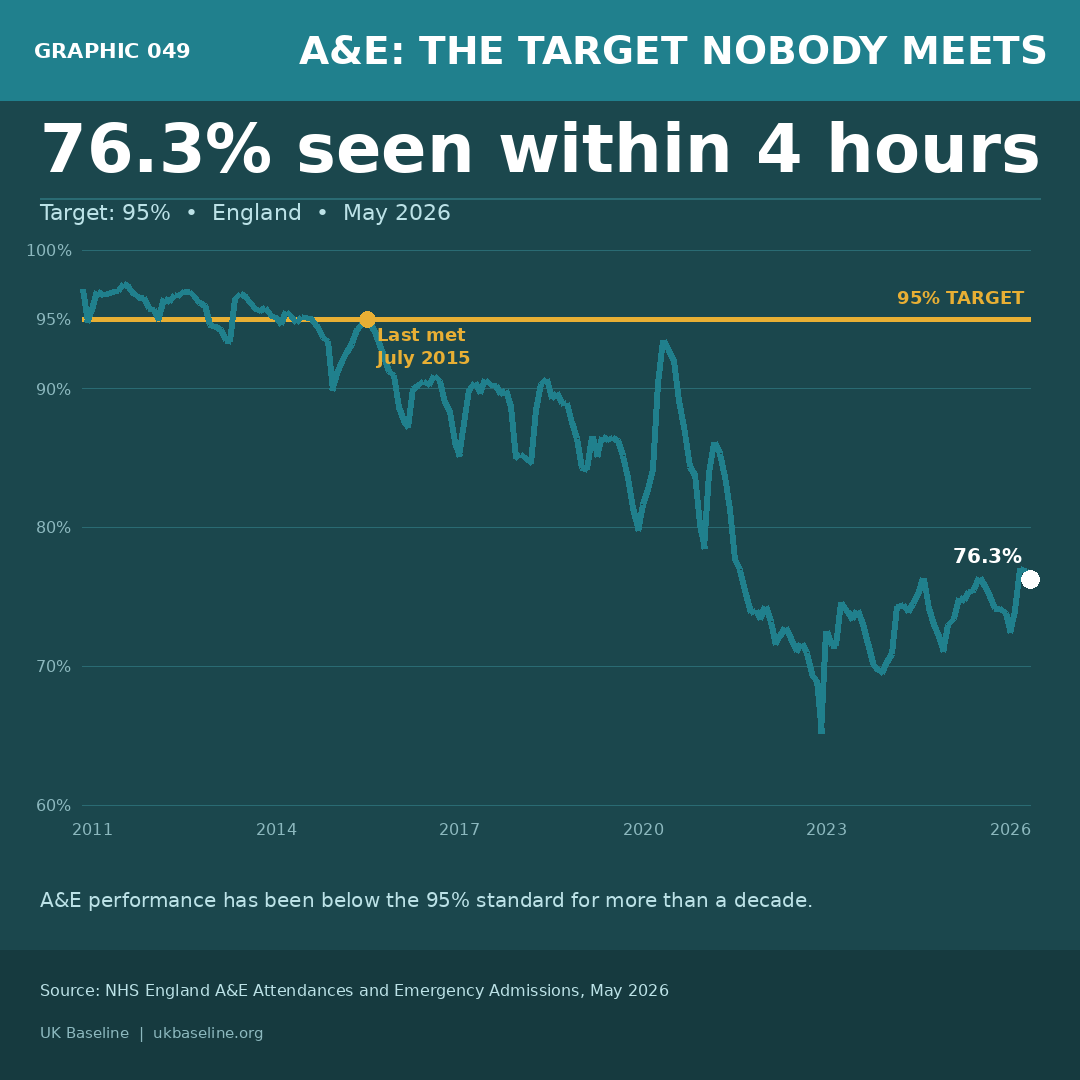
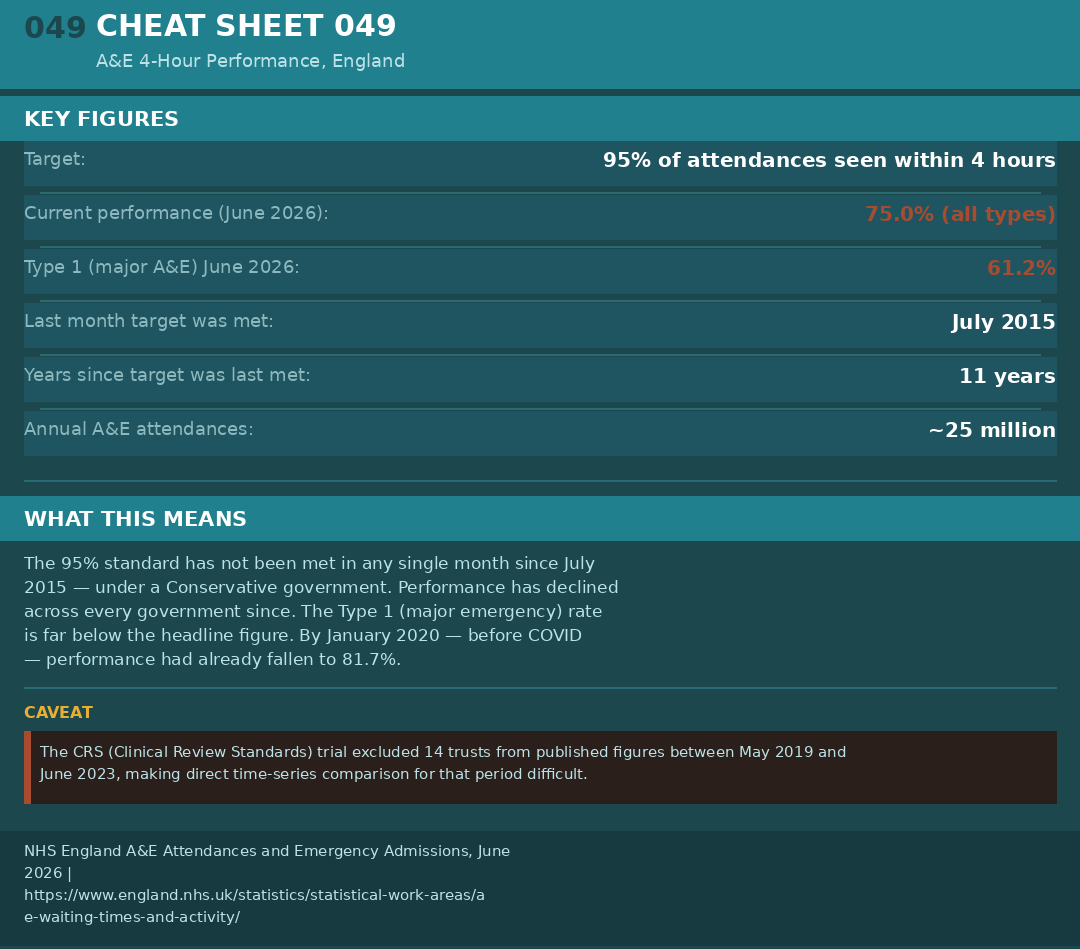
Percentage of A&E attendances seen within 4 hours, England, November 2010 to June 2026. The 95% target was last met in July 2015. By January 2020 — before COVID — performance had already fallen to 81.7%. By June 2026: all-type departments at 75.0%, major emergency (Type 1) departments at 61.2%. The decline spans 13 years and three governments.
The Productivity Gap
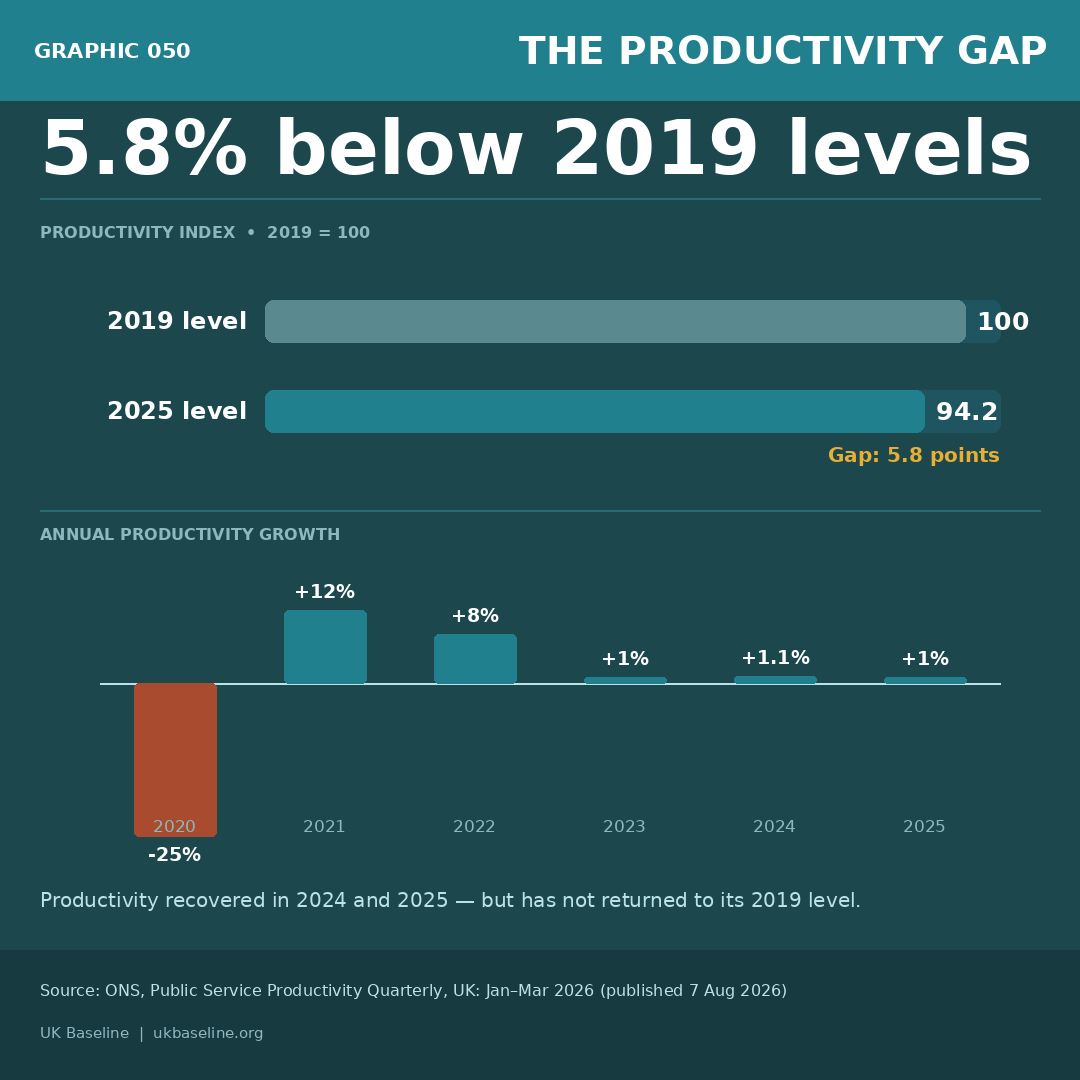
NHS healthcare productivity, UK. ONS data published August 2026 shows healthcare productivity in 2025 was 5.8% below its 2019 level — revised from a previously published 7.8% gap. Productivity grew 1.0% in 2025 and 1.1% in 2024, the fifth consecutive year of growth since the pandemic. Output growth is outpacing input growth, but the level has not recovered. Total public service productivity is 2.5% below 2019.
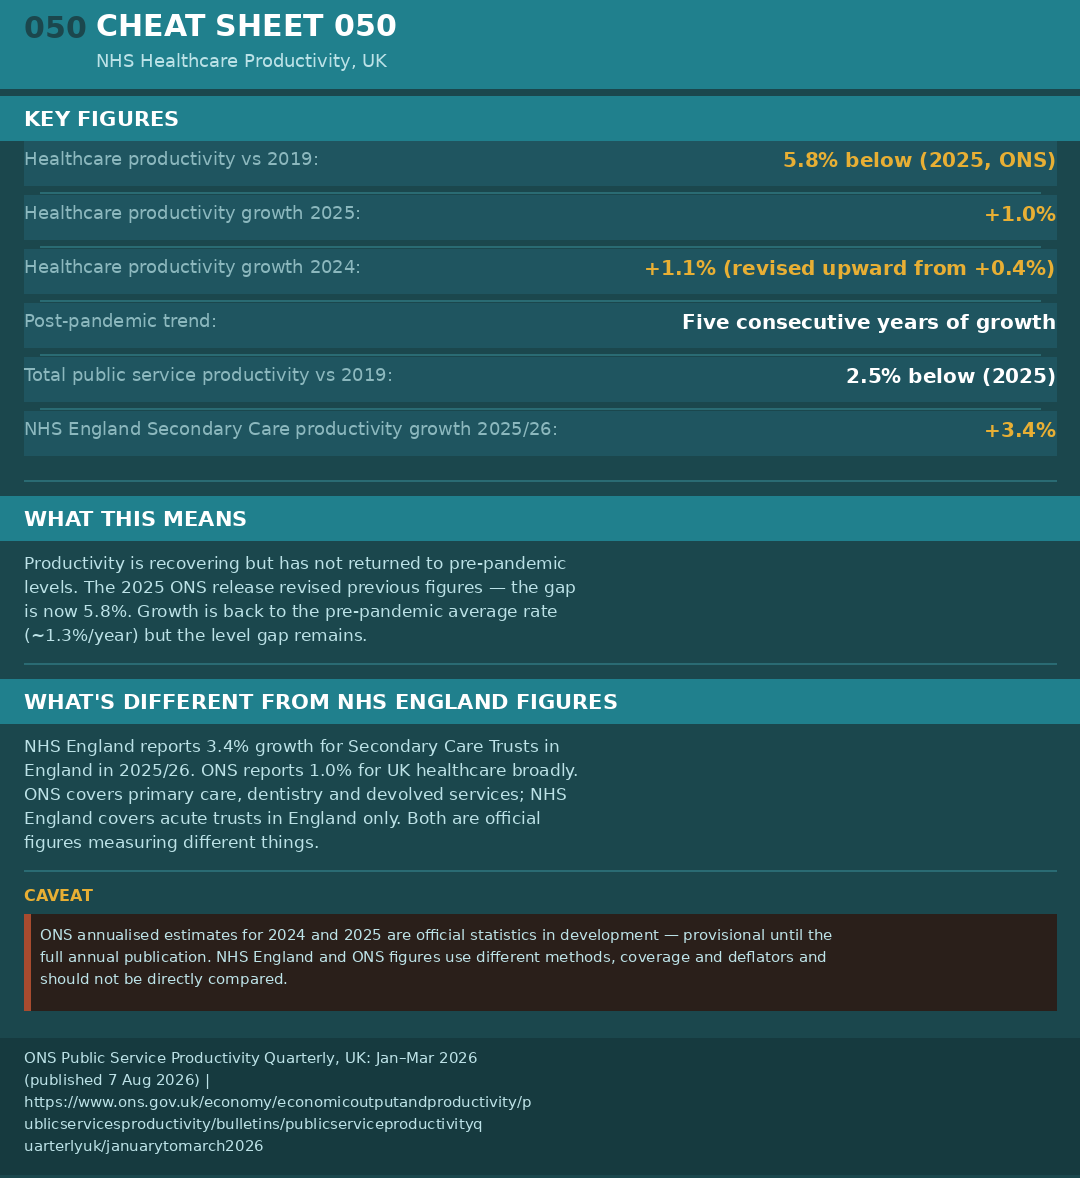
ONS annualised estimates for 2024 and 2025 are official statistics in development — provisional until the full annual publication. NHS England reports 3.4% productivity growth for Secondary Care Trusts in England in 2025/26 — a higher figure than the ONS 1.0% because it covers a different scope, period, and method. Both are official; they measure different things.
More Staff, Same Pressure
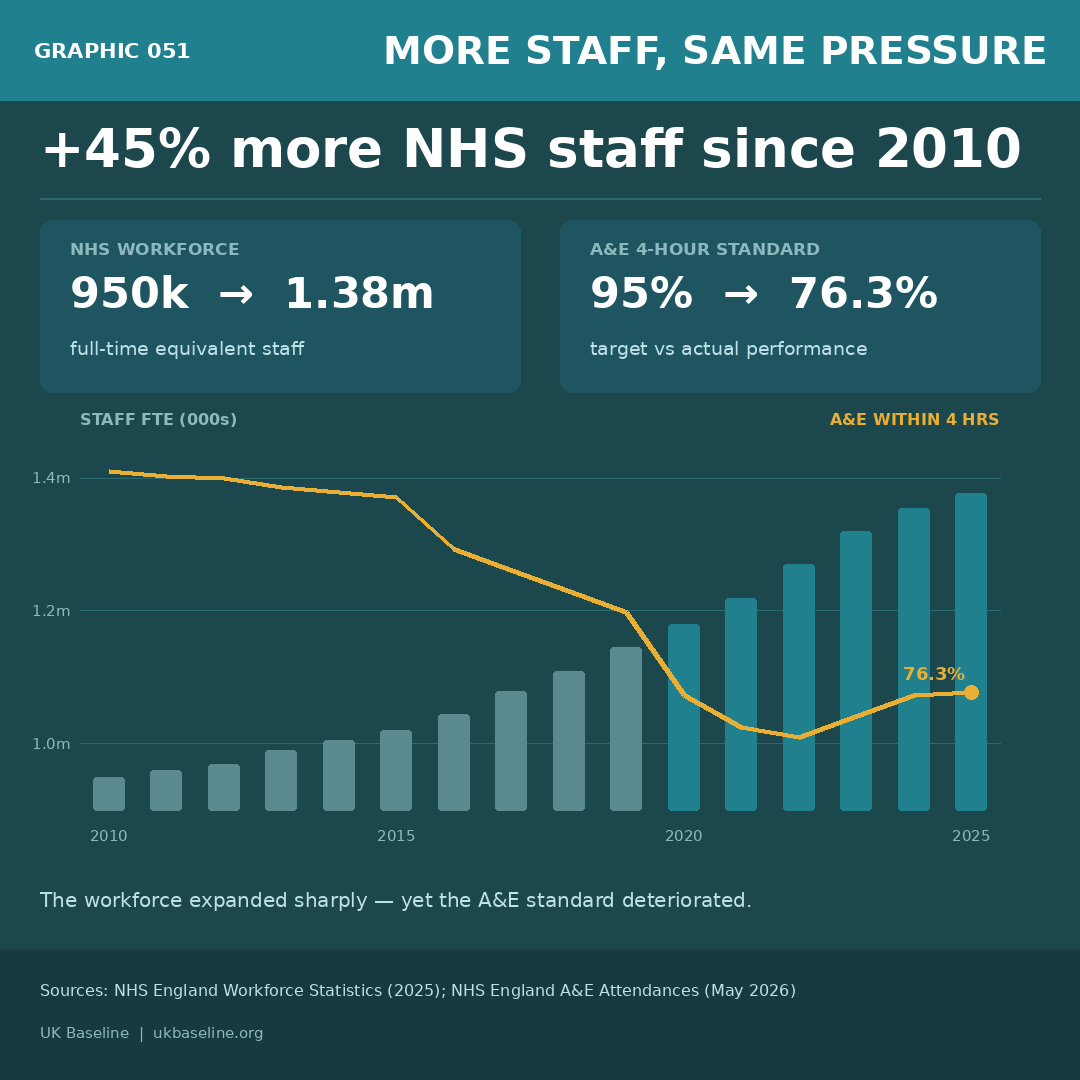
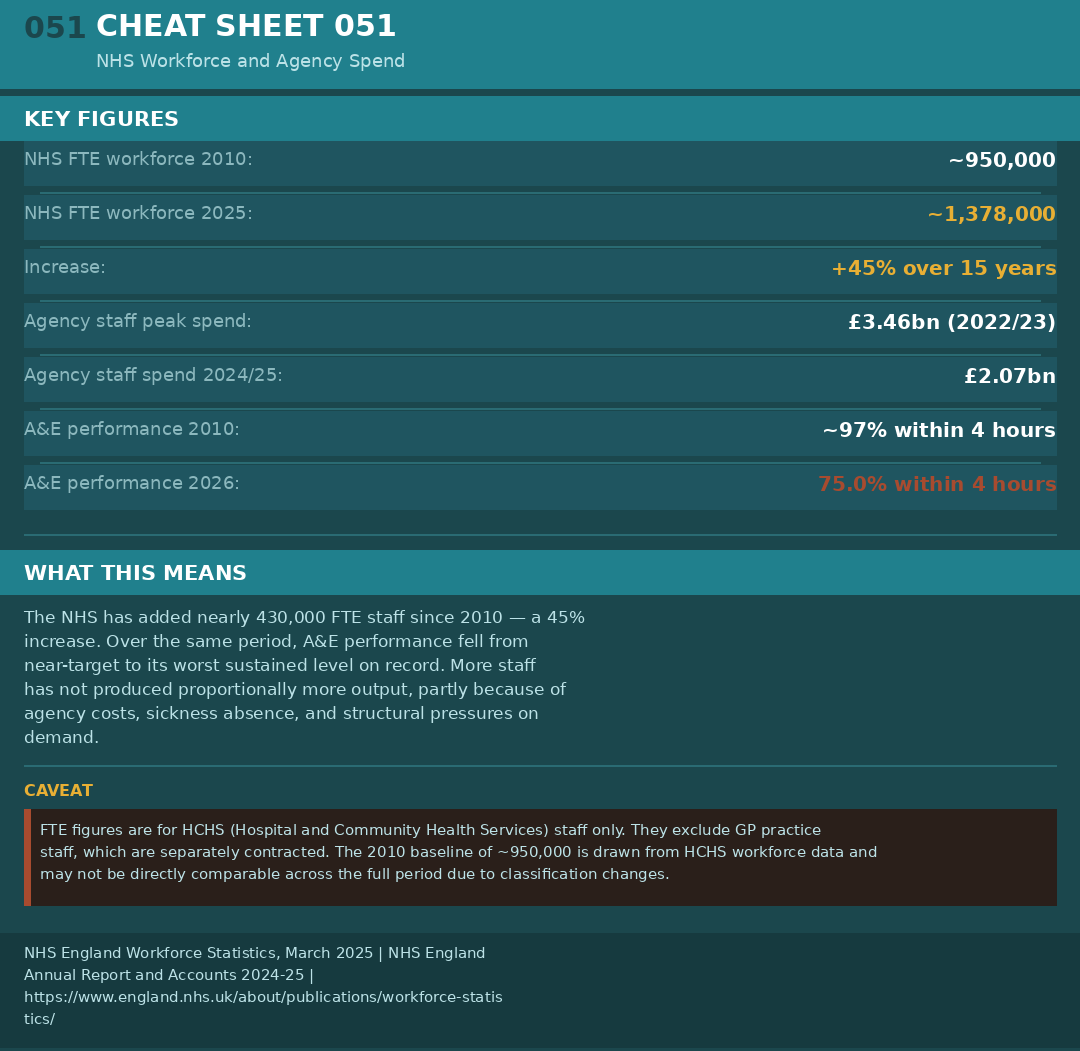
NHS workforce FTE growth (left) and agency staff spend (right), England. NHS headcount grew by approximately 45% between 2010 and 2025 — from around 950,000 to 1,378,000 FTE. Over the same period, agency staffing costs peaked at £3.46 billion in 2022/23 before falling to £2.07 billion in 2024/25. Despite the headcount growth, productivity fell below pre-pandemic levels and waiting lists continued to grow. More staff did not translate into proportionally more output.
Cancer: Missing the Standard
62-day cancer treatment standard performance, England, October 2009 to April 2026. The 85% target was broadly met in 2009 to 2013. It has not been met since. By April 2026, performance stood at 70.0%. In October 2023, NHS England revised the standard's methodology — capturing up to 50% more patient pathways — meaning pre- and post-revision figures are not directly comparable.
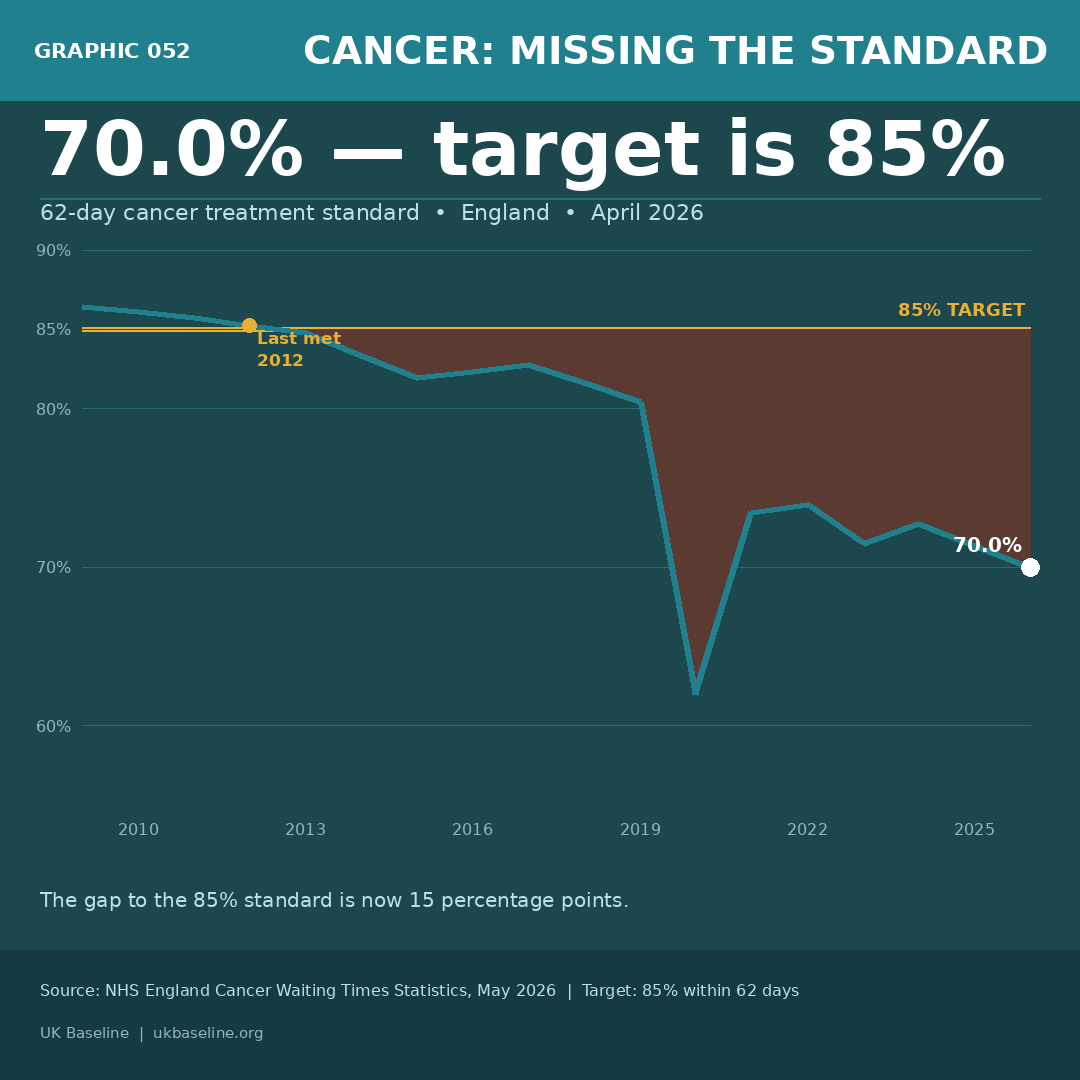
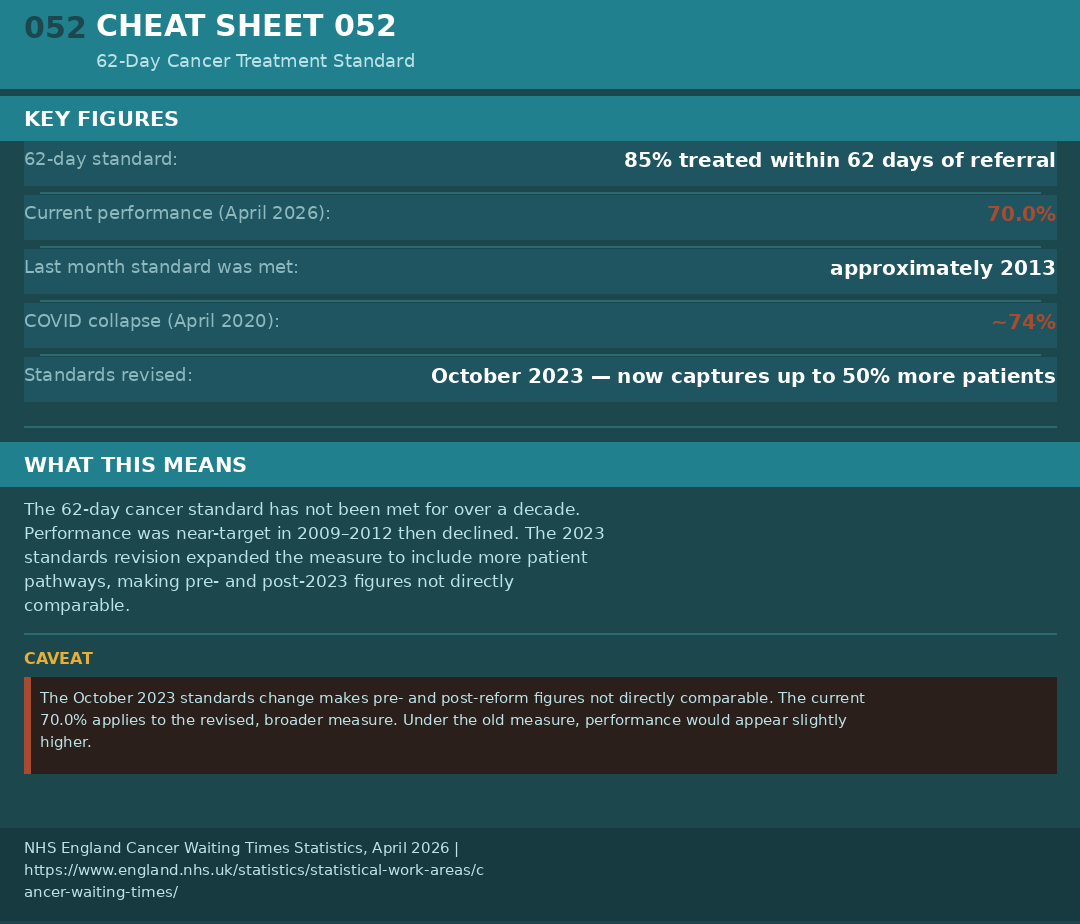
The October 2023 standards revision expanded the denominator to capture up to 50% more patient pathways under the 62-day measure. Pre- and post-revision figures are not directly comparable on a like-for-like basis. Performance after the revision appears lower partly because more pathways are counted, not solely because treatment speed has worsened. The 85% target remains unchanged.
What the UK Spends
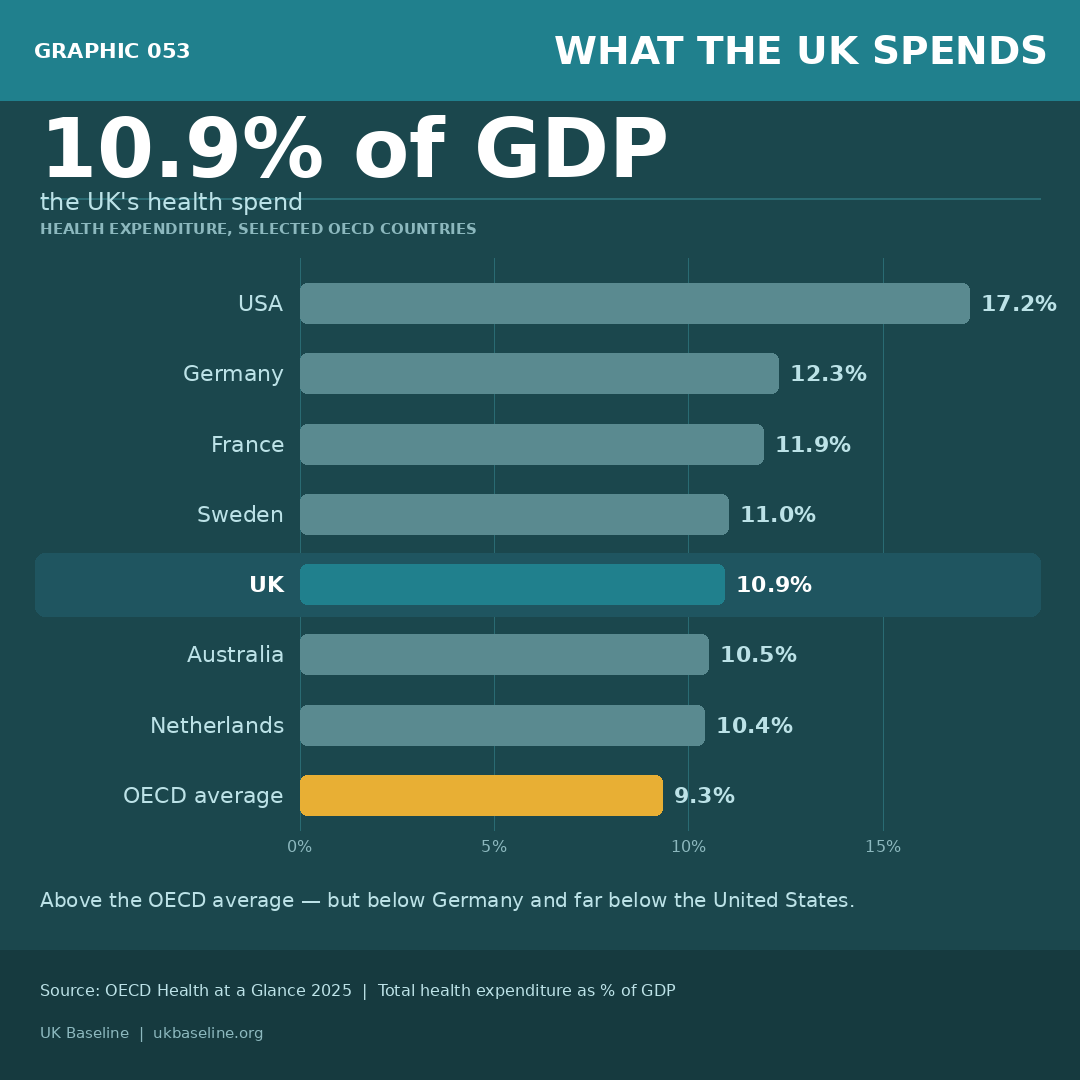
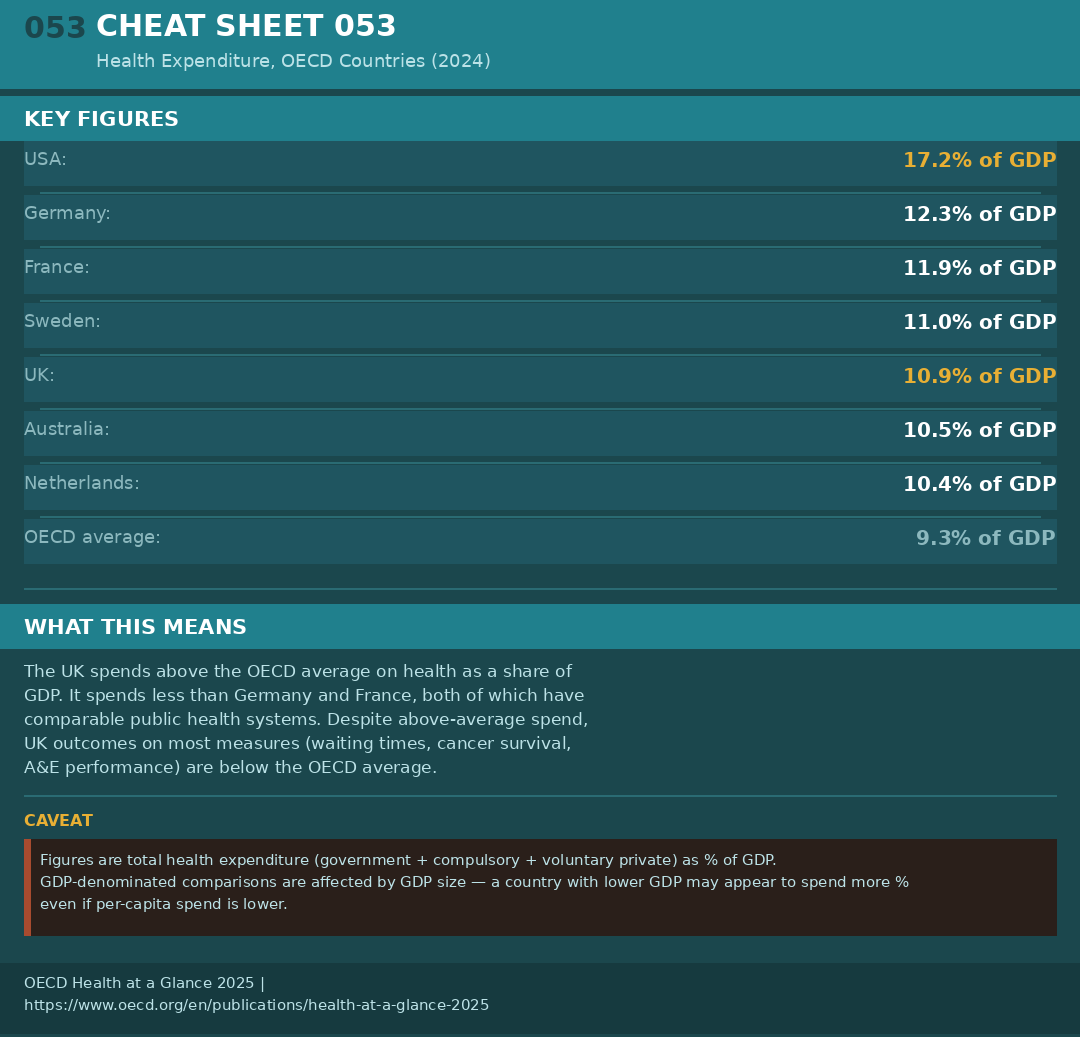
Health expenditure as a percentage of GDP, selected OECD countries, 2024. The UK spends 10.9% of GDP on health — above the OECD average of 9.3% and broadly comparable to France (11.9%), Sweden (11.0%), and Canada (11.5%). The UK spends significantly less than Germany (12.3%) and far less than the USA (17.2%). Above-average spending has not produced above-average outcomes on most OECD measures.