The Housing Crisis
The housing crisis is routinely framed as someone else's fault: Labour councils blocking planning, or Conservative governments selling off social housing, or migrants driving up demand. The data shows all three narratives are partially true, partially misleading, and collectively insufficient to explain four decades of systemic underbuilding. No government has hit the 300,000 target since it was set. The affordability ratio has doubled. 126,000 households are in temporary accommodation. Seven graphics. The data only.
The housing crisis has no single cause and no single villain. The data implicates planning obstruction across both Conservative and Labour councils; the sale of social housing without replacement across decades under multiple governments; demand-side subsidies that inflated prices; and a demand surge from post-2021 migration that the 300,000 target was never calibrated to absorb. Any single-cause account of the housing crisis is incomplete. The data supports urgency, not partisanship.
The Target Nobody Hits
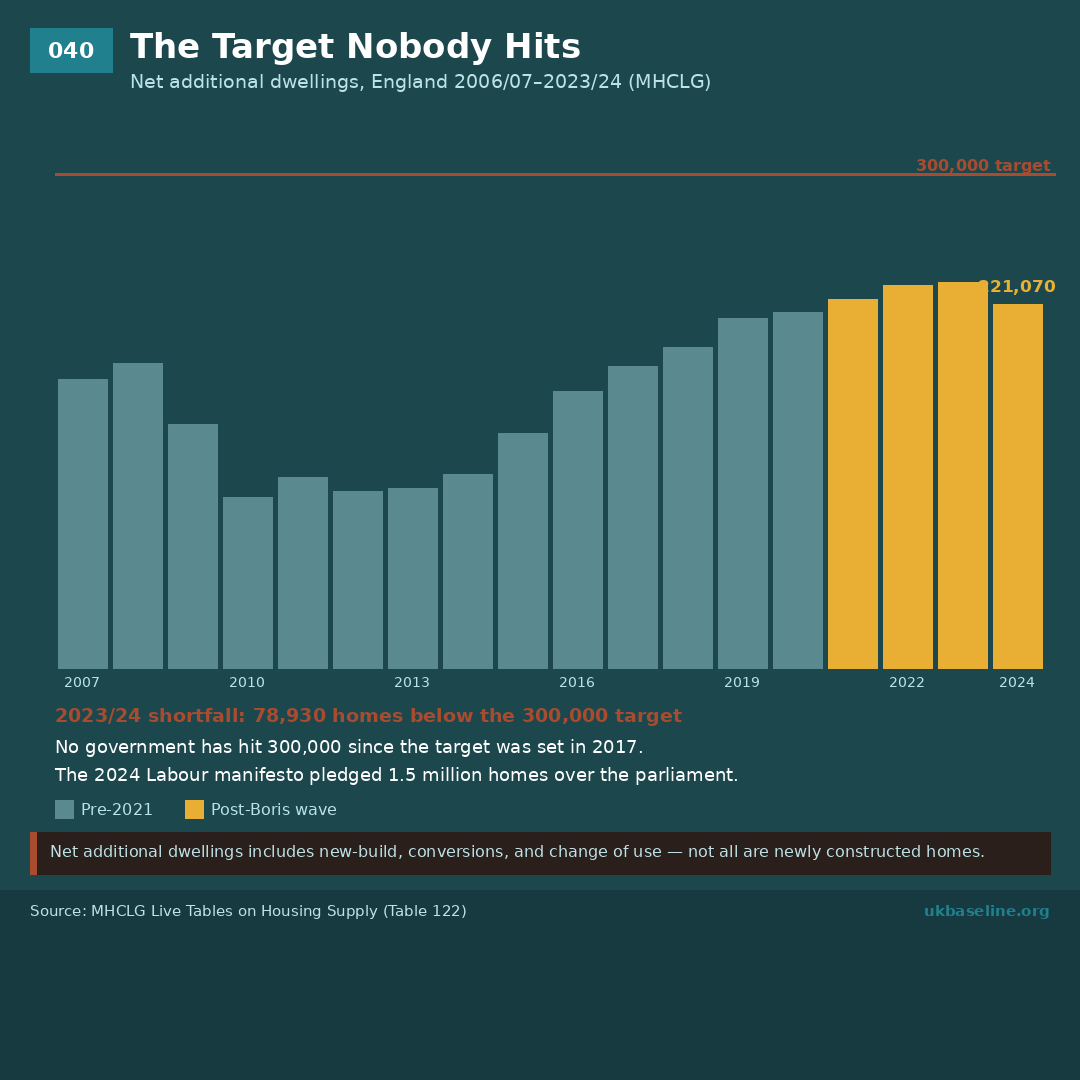
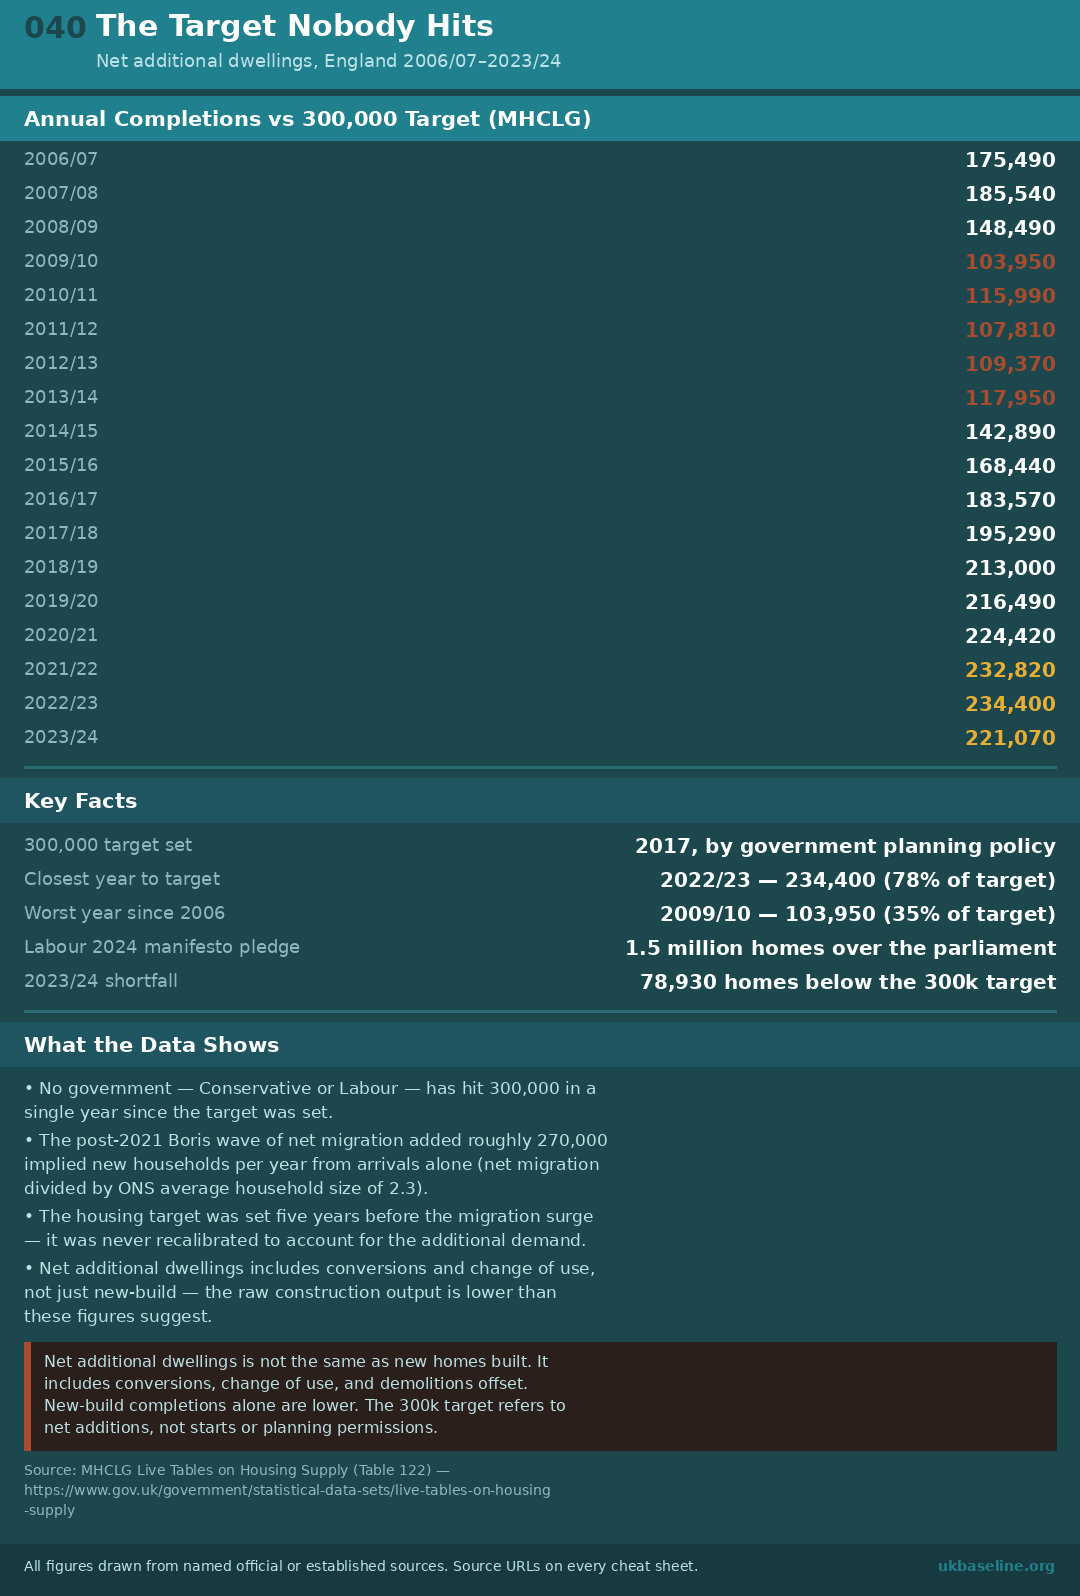
Net additional dwellings in England, 2006/07–2023/24. The government target of 300,000 homes per year has never been met since it was formally set in 2017. The closest year was 2022/23 at 234,400 — 78% of target. In 2023/24, completions fell to 221,070. No government — Conservative or Labour — has come close.
The Affordability Collapse
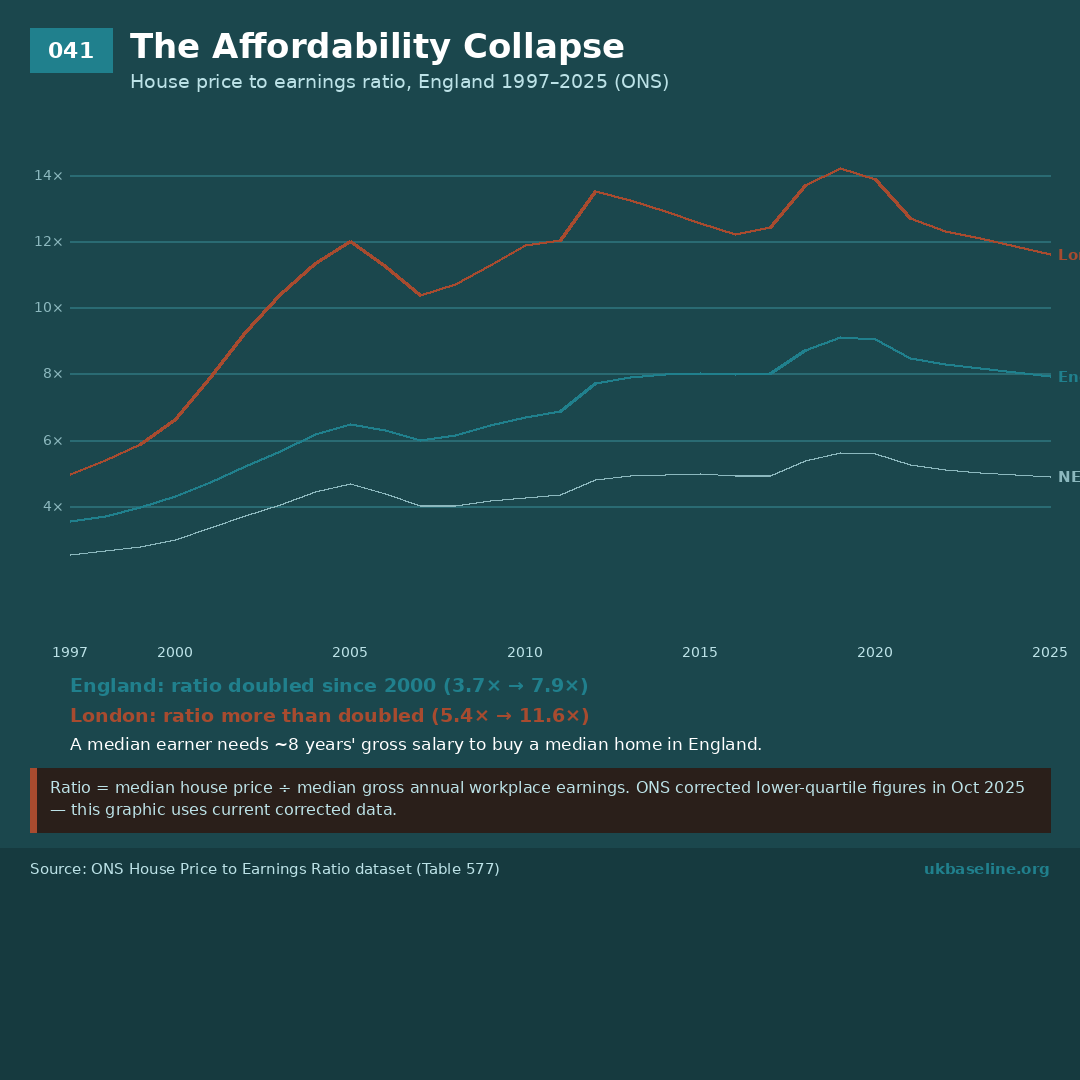
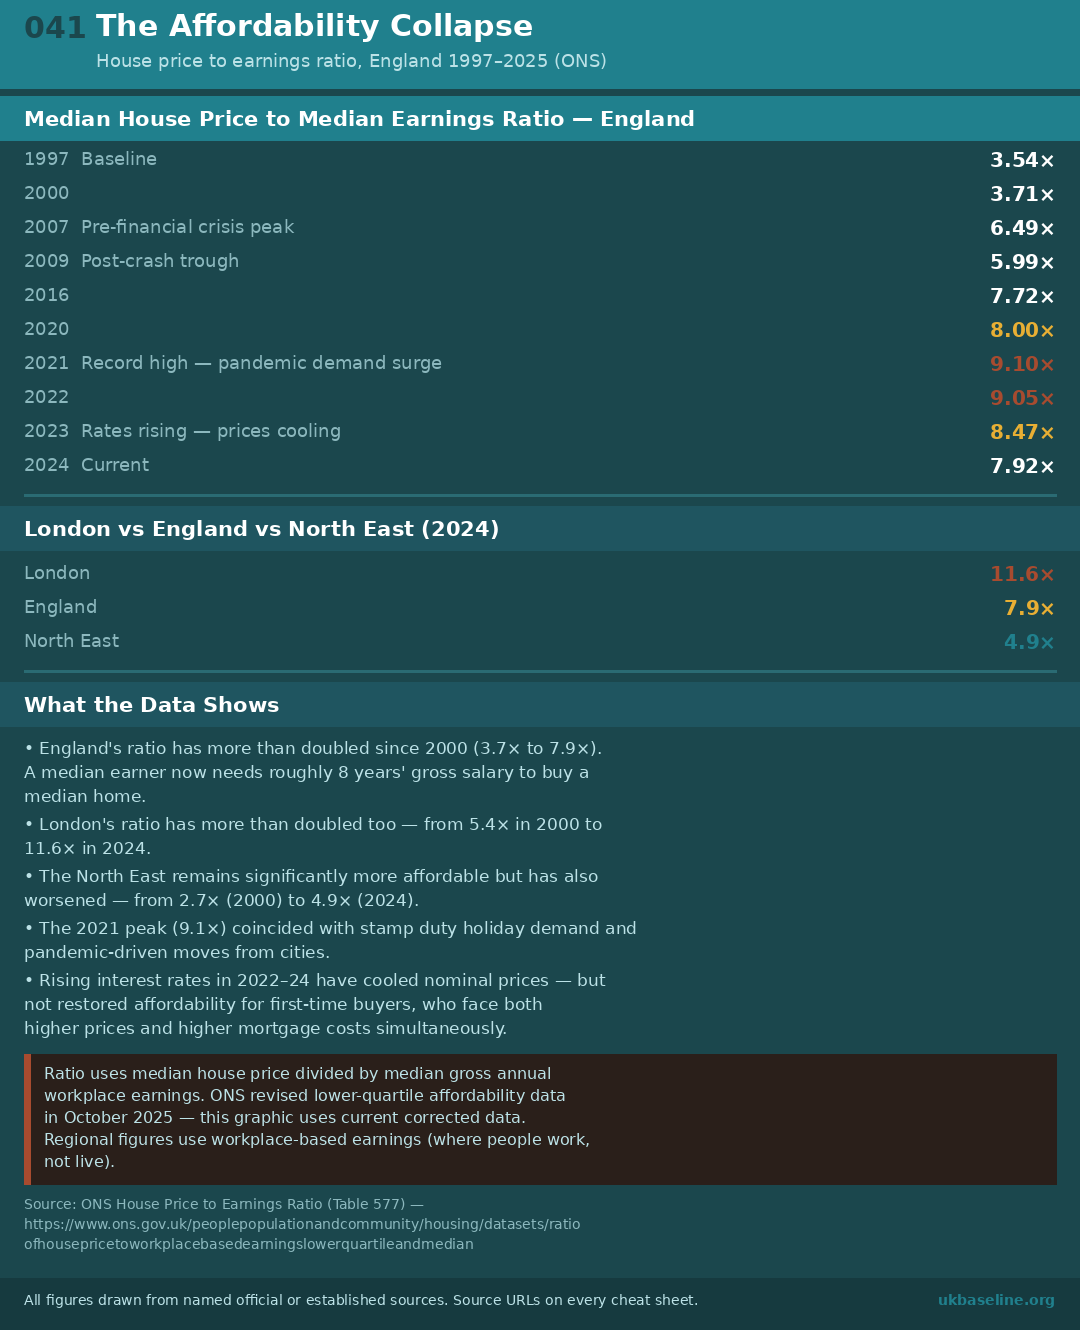
ONS median house price to median earnings ratio, England 1997–2025. England's ratio has more than doubled since 2000 — from 3.7× to 7.9×. London has gone from 5.4× to 11.6×. A first-time buyer on a median income now needs roughly 8 years' gross salary to purchase a median-priced home in England, before accounting for mortgage costs.
Right to Buy: The Long Subtraction
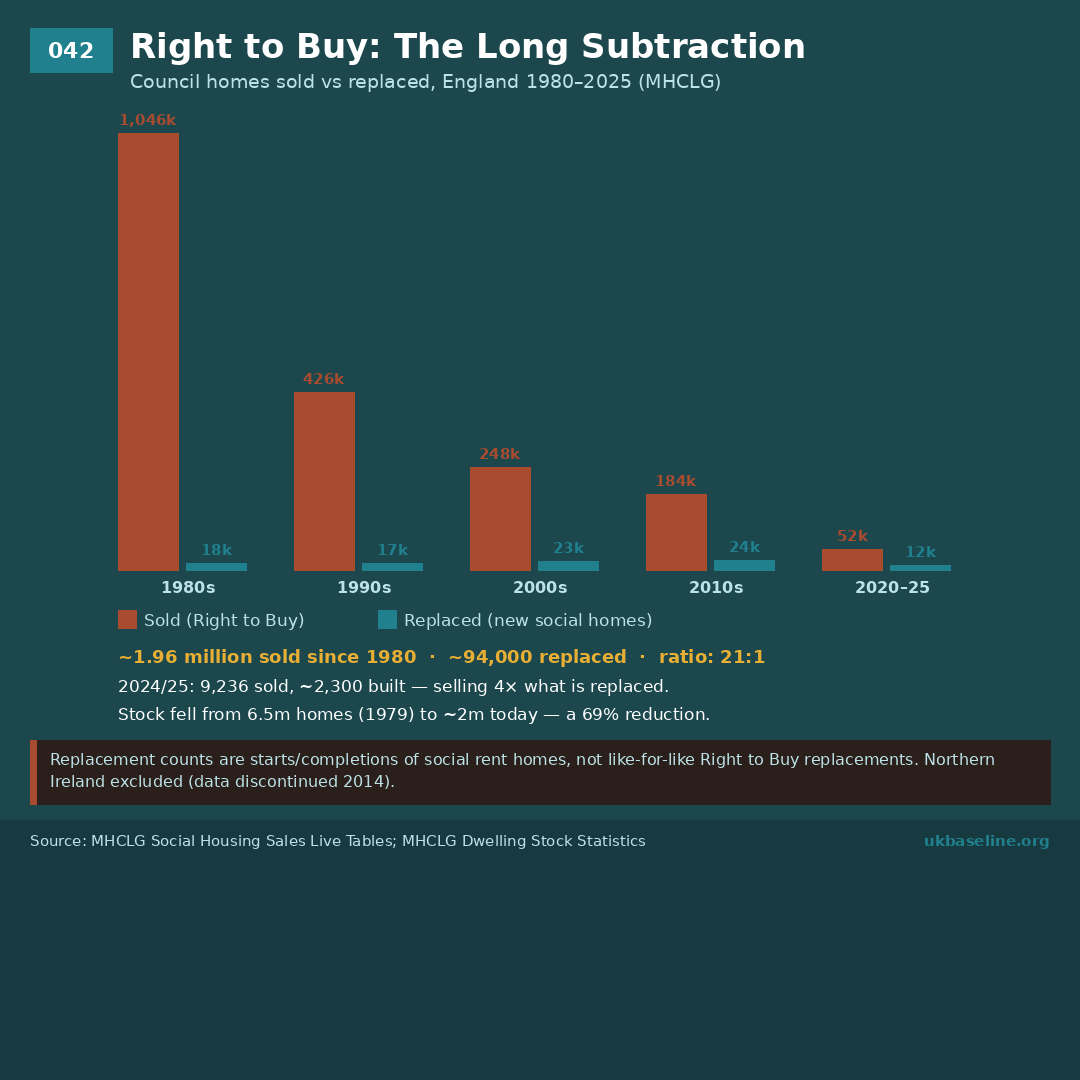
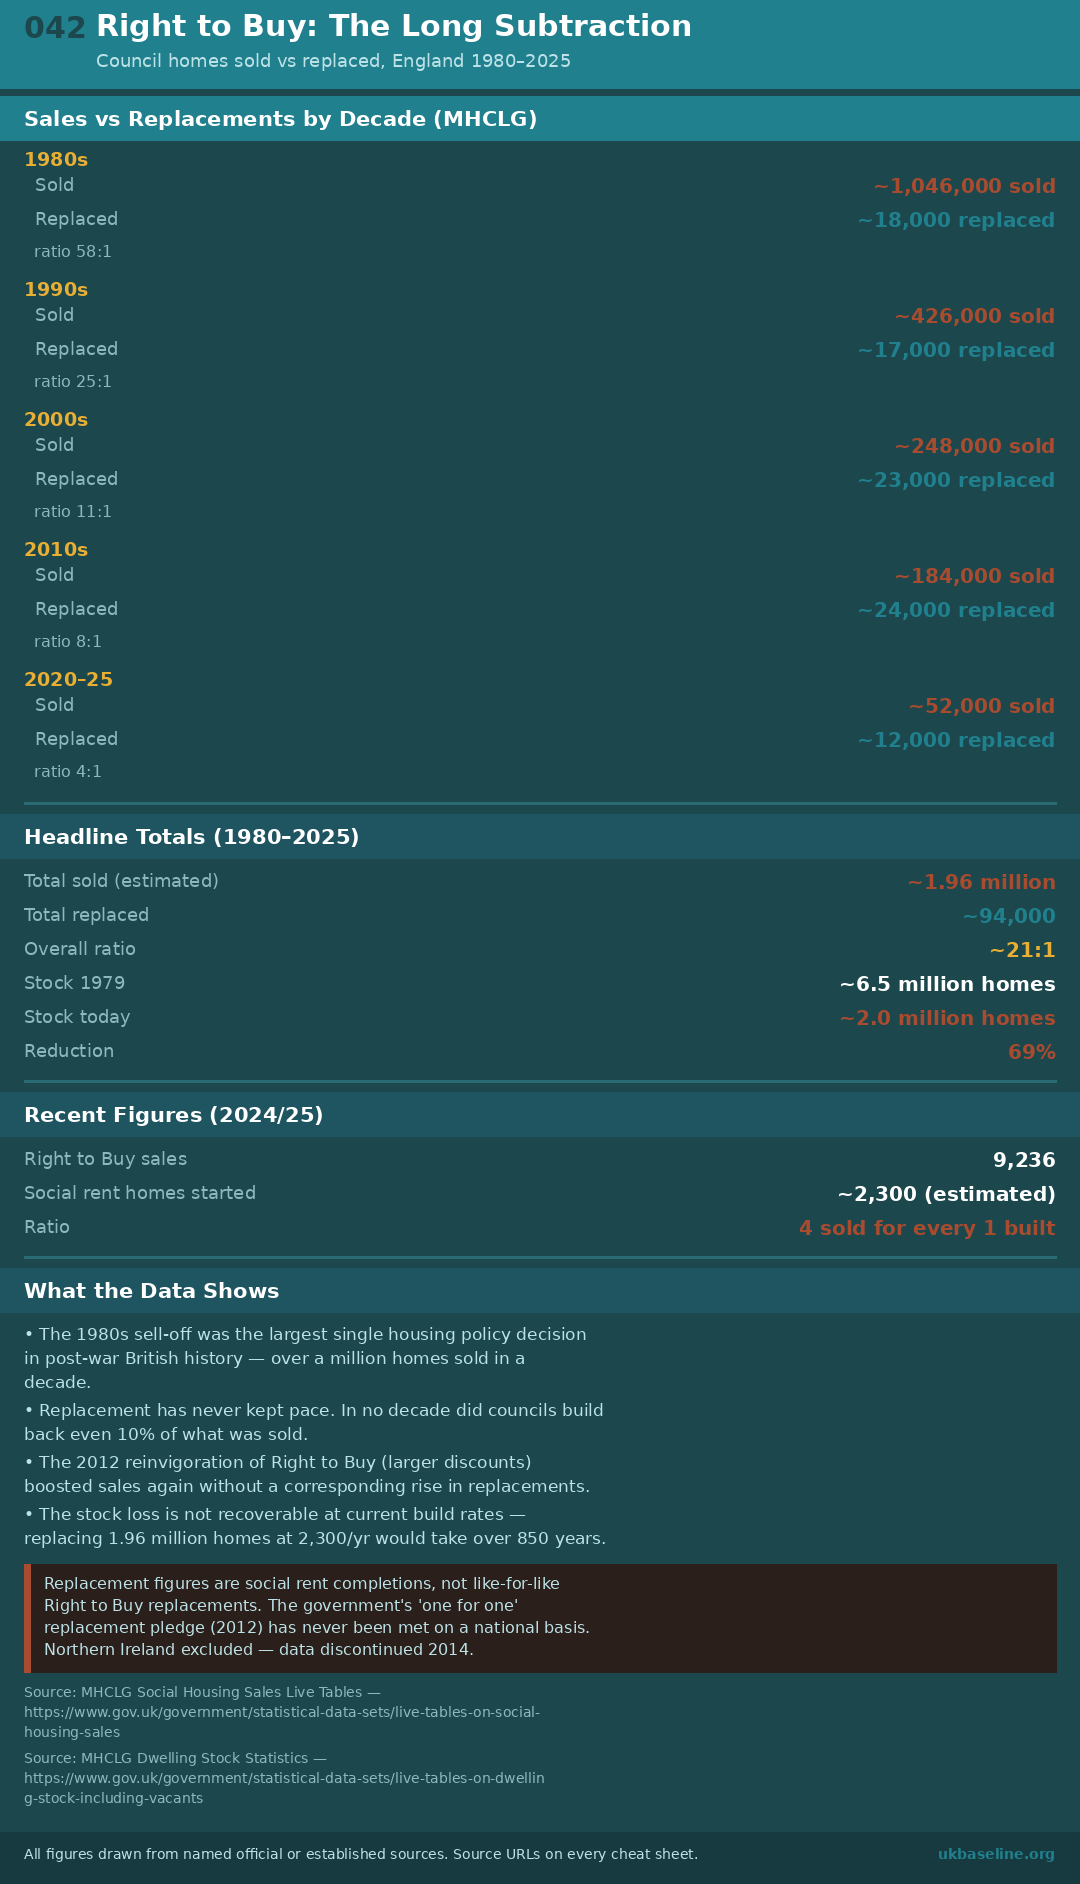
Council homes sold vs replaced in England by decade, 1980–2025. Since 1980, approximately 1.96 million council homes have been sold under Right to Buy. Around 94,000 have been replaced — a ratio of roughly 21:1 across the full period. In 2024/25, 9,236 were sold and approximately 2,300 social rent homes were built. The social housing stock has fallen from 6.5 million homes in 1979 to around 2 million today — a 69% reduction.
Who Is Actually Blocking Planning?
Major residential planning application approval rates, England 2023/24. The England average is 74%. The 10 councils with the lowest approval rates for major residential applications include 6 Conservative-controlled and 4 Labour-controlled authorities. The lowest-approving councils are predominantly affluent shire and outer districts — not Labour-run urban areas, as is often claimed. Woking (Conservative) approves only 43% of major residential applications.
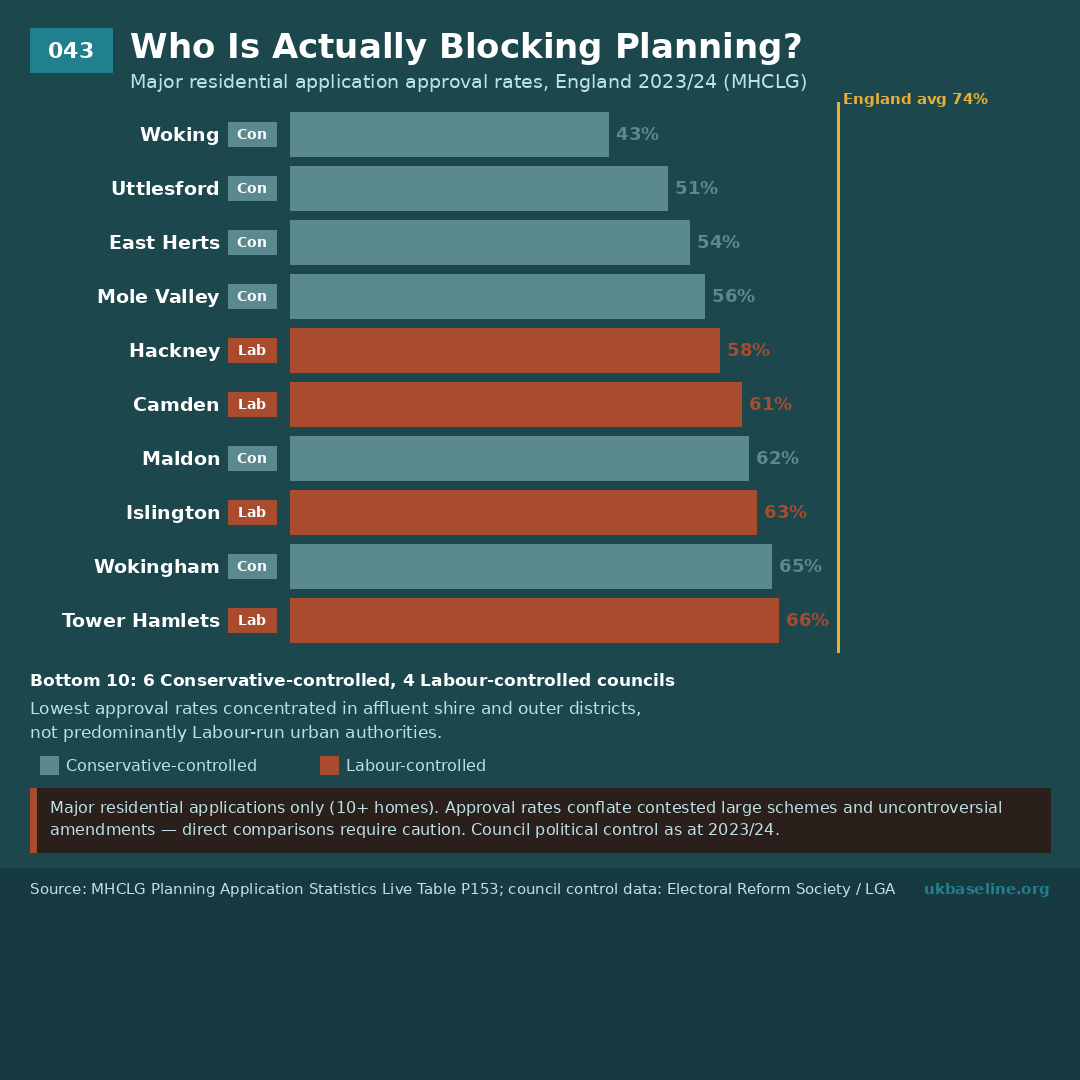
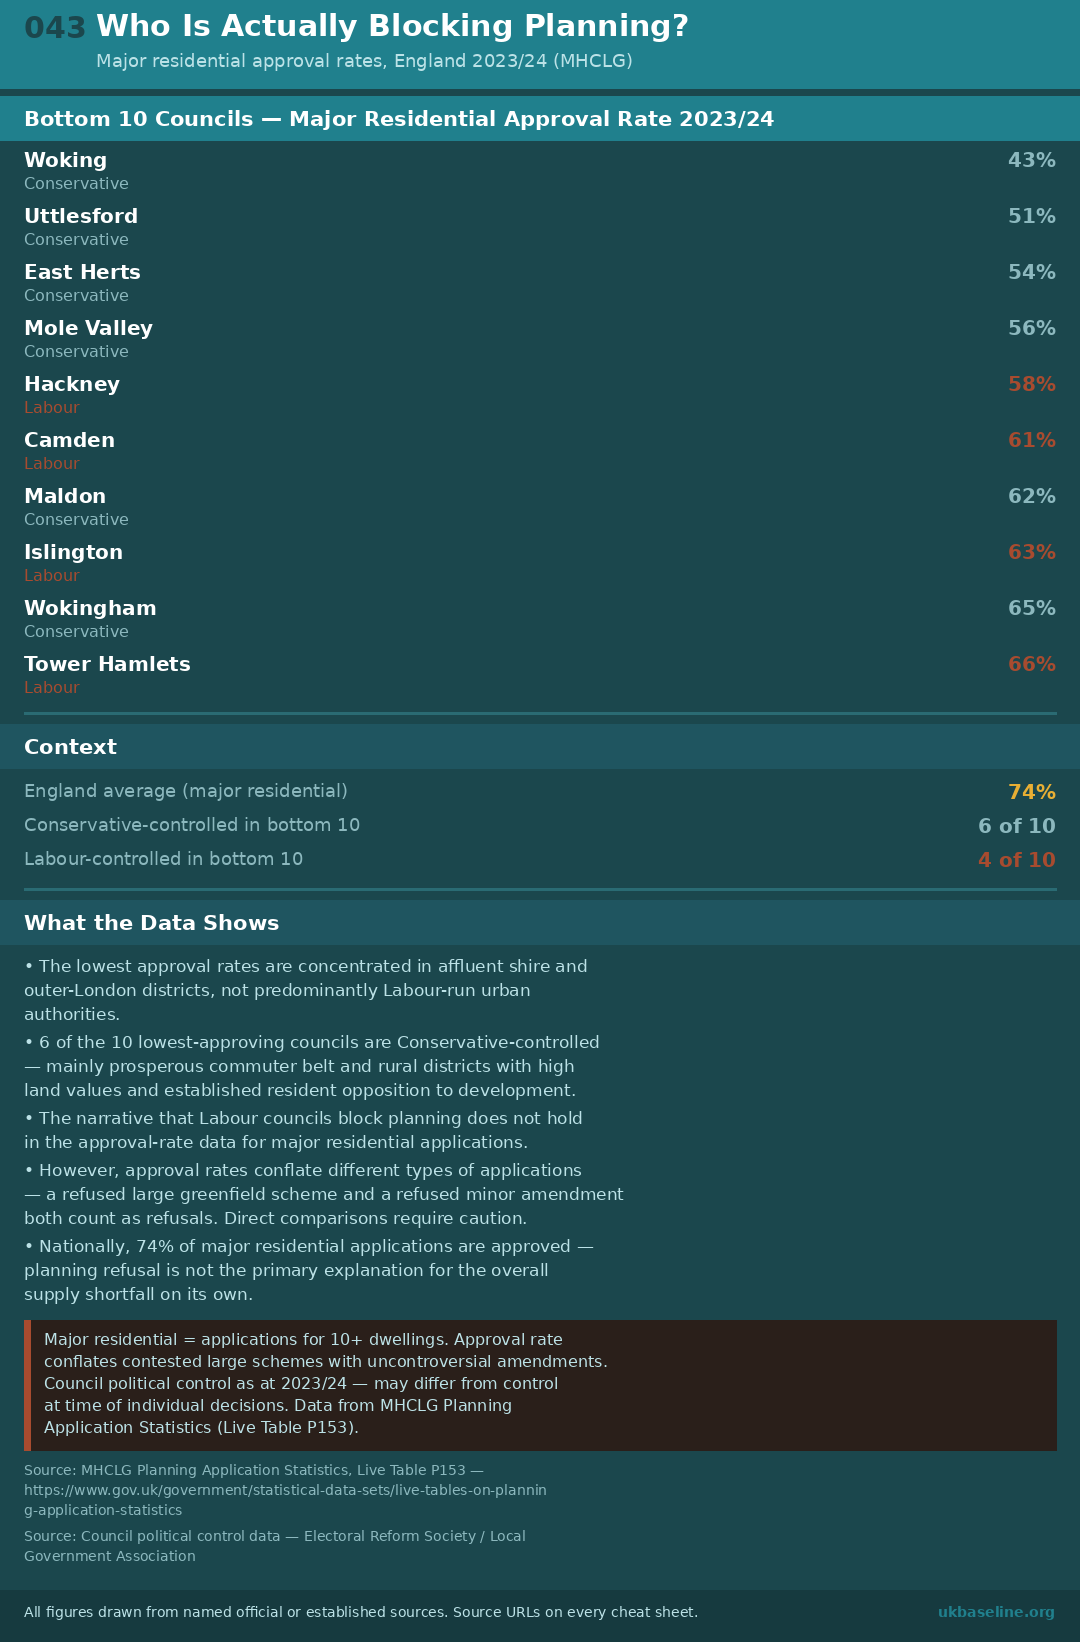
Major residential approval rates conflate different types of applications — a refused large greenfield scheme and a refused minor amendment both count as refusals. This graphic shows the pattern in the raw data; it does not prove that any specific council is obstruction-motivated. The national data does not support the claim that Labour councils are systematically the worst offenders on planning — but it also does not mean planning obstruction is not a problem.
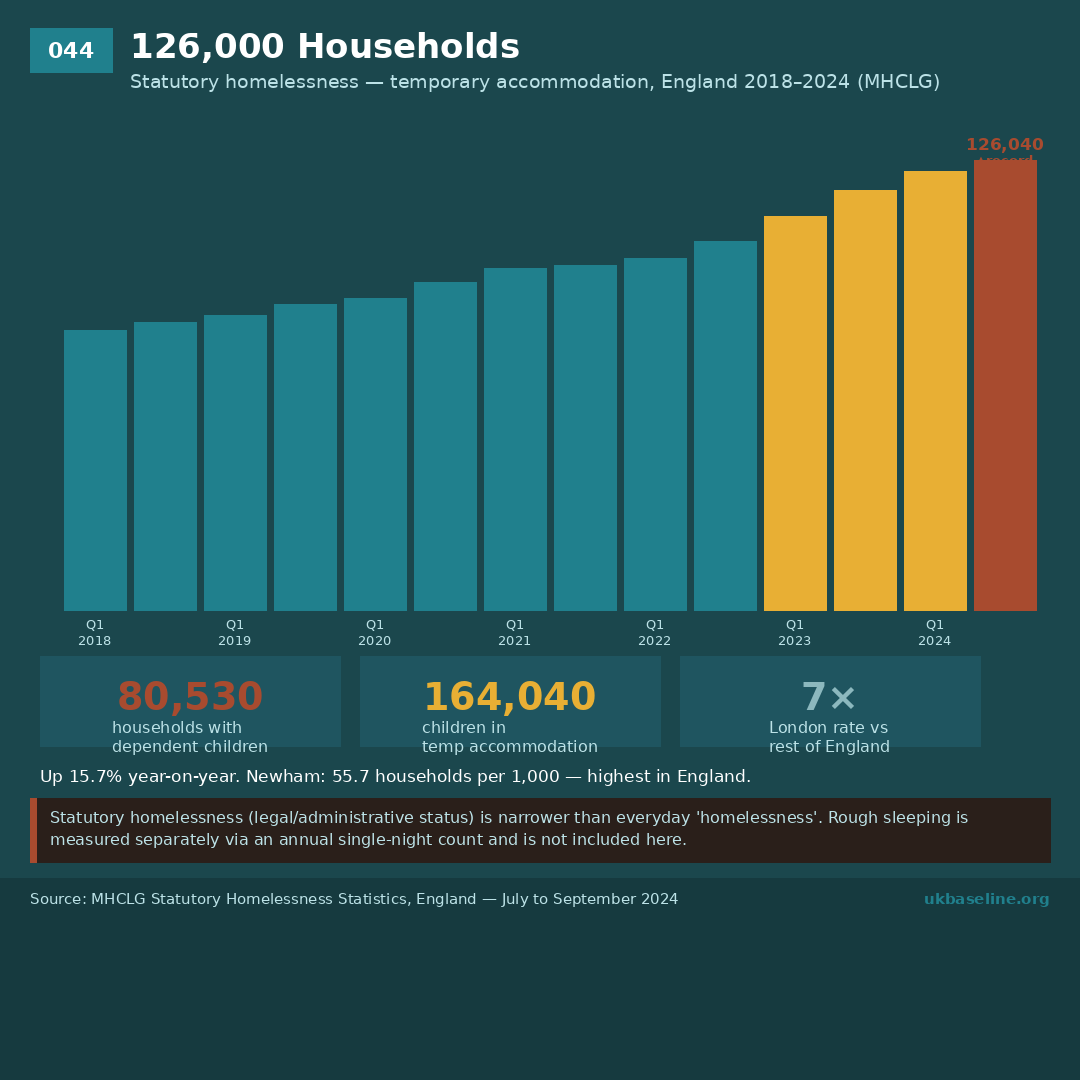
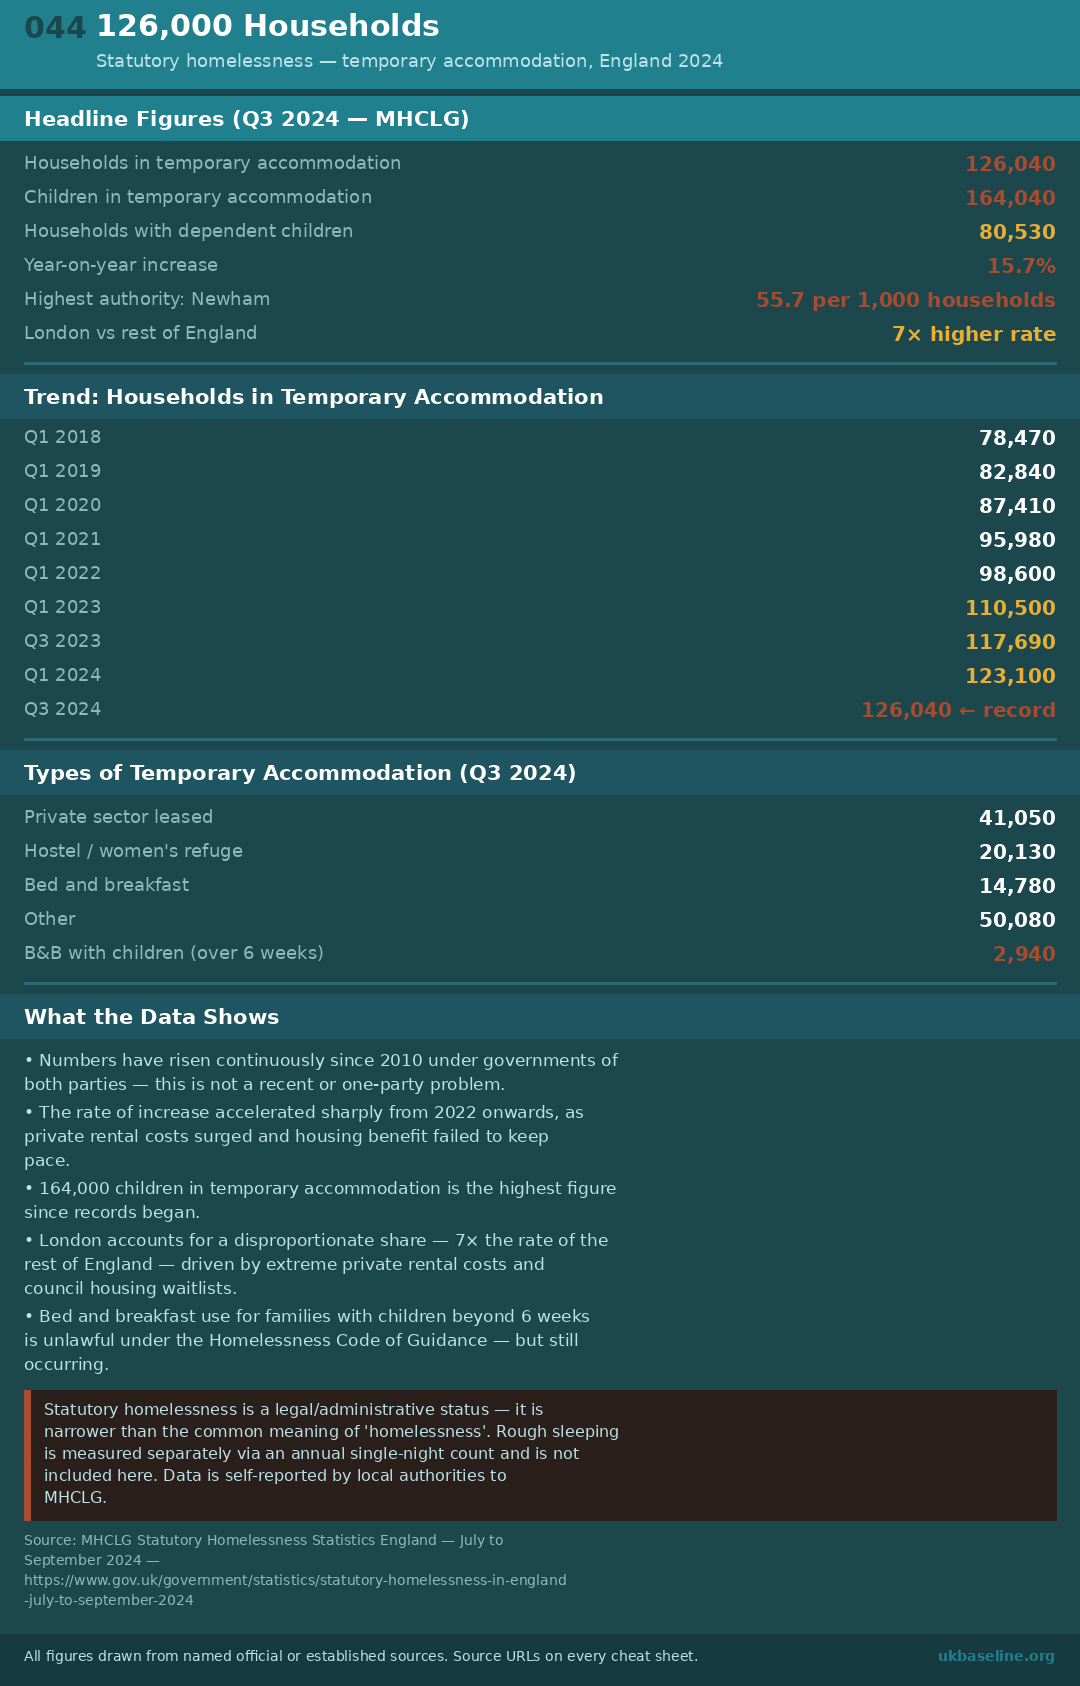
126,000 Households
Households in temporary accommodation, England, Q1 2018 to Q3 2024. The figure reached 126,040 in September 2024 — a record high and a 15.7% year-on-year increase. 164,040 children are living in temporary accommodation. London's rate is 7× the rest of England. Numbers have risen continuously under governments of both parties since 2010.
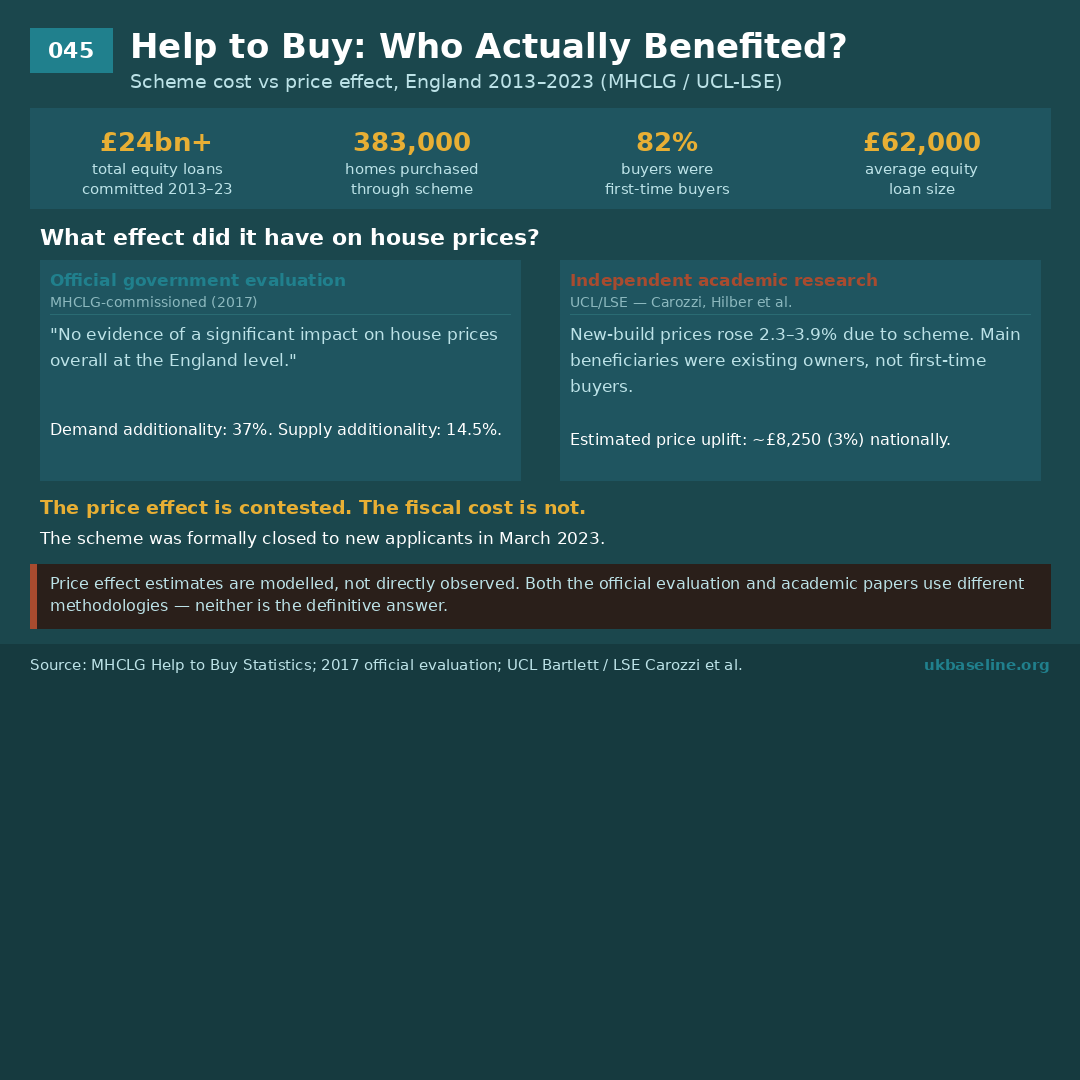
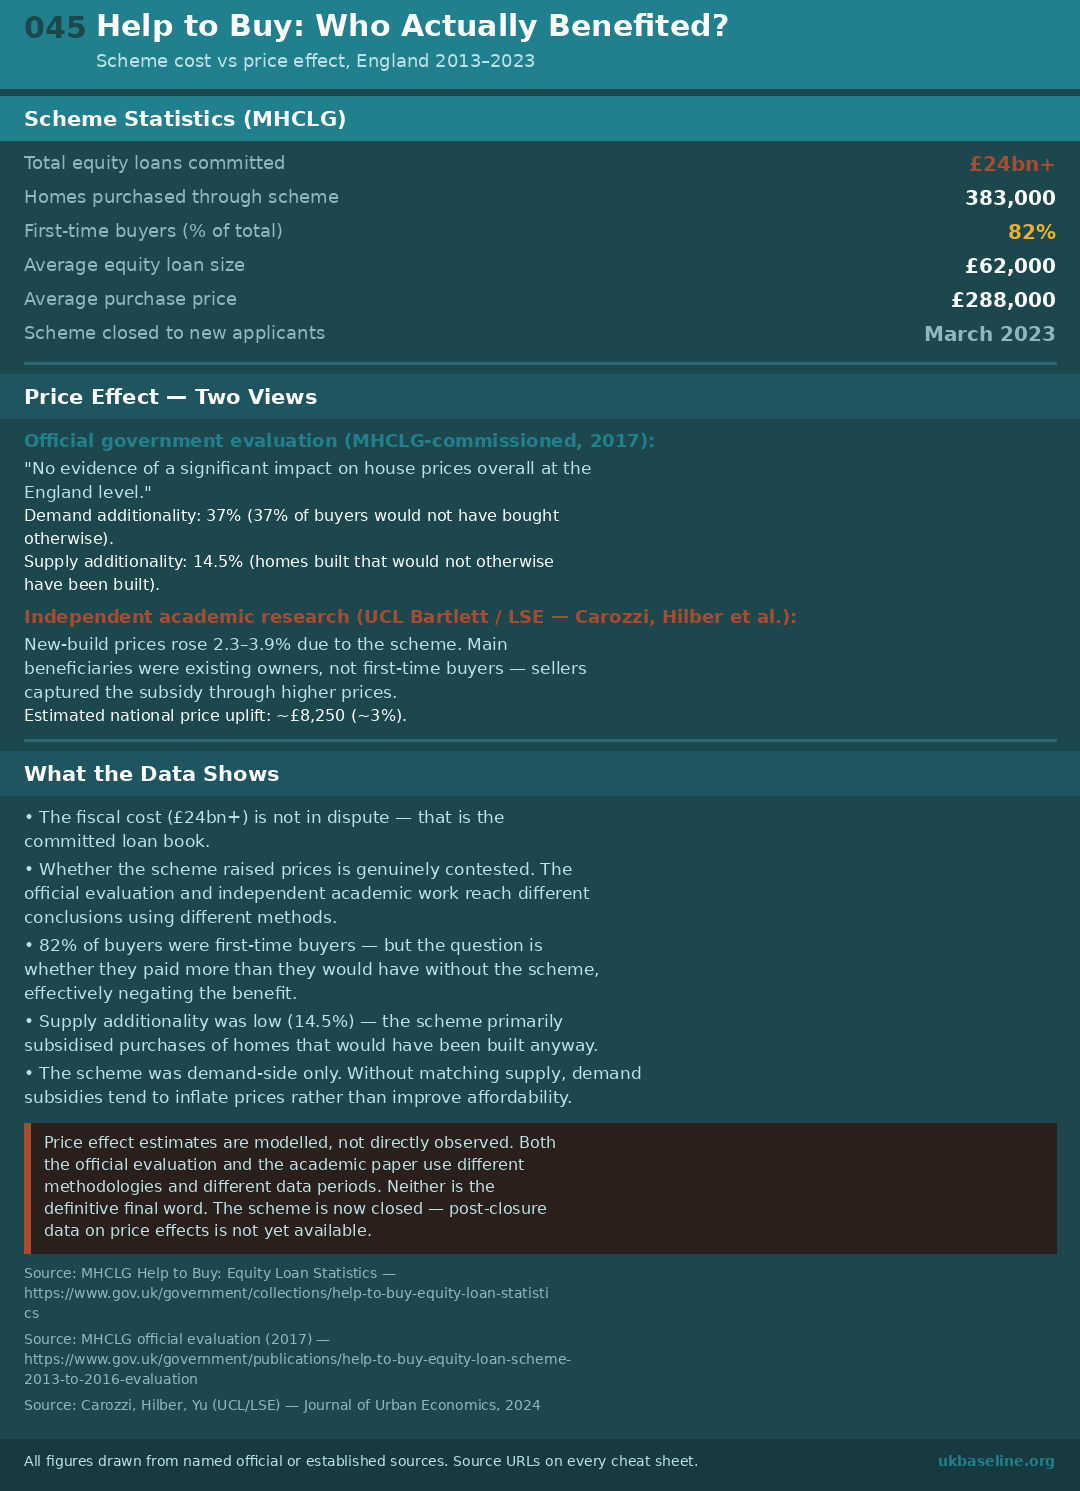
Help to Buy: Who Actually Benefited?
The Help to Buy equity loan scheme (2013–2023) committed over £24bn in loans to 383,000 buyers, 82% of whom were first-time buyers. The official government evaluation found no significant house price impact. Independent academic research from UCL and LSE found new-build prices rose 2.3–3.9% as a result — meaning sellers captured part of the subsidy. The price effect remains contested; the fiscal cost does not.
The Demand the Target Never Foresaw
Net migration to England vs homes built, 2017–2024. The 300,000 target was set in 2017. From 2022, net migration averaged 625,000 per year — implying roughly 270,000 additional households per year from arrivals alone, before accounting for natural population growth or existing backlogs. Homes actually built fell during this period, from 234,000 (2023) to 221,000 (2024). The target was arithmetically insufficient before it was ever missed.
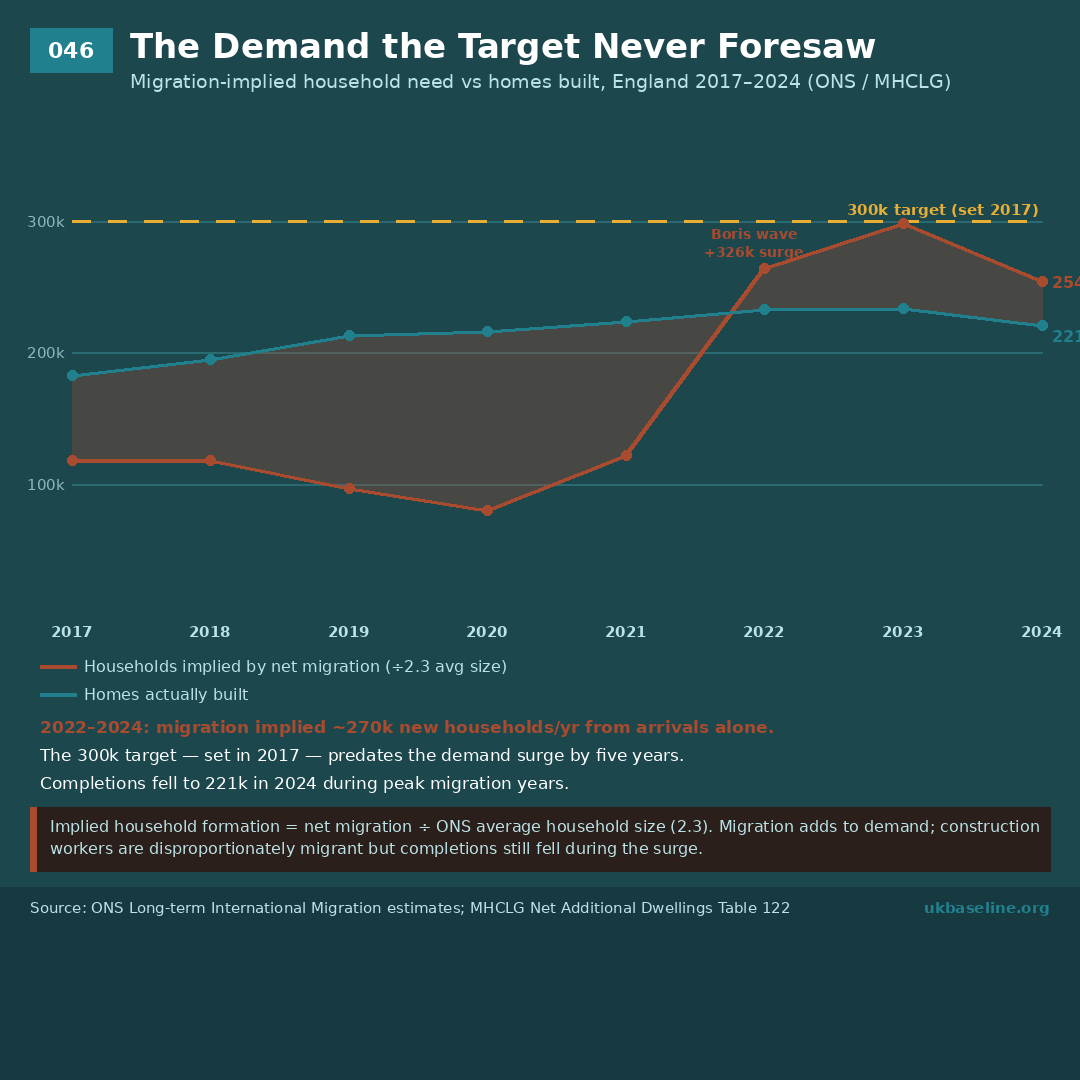
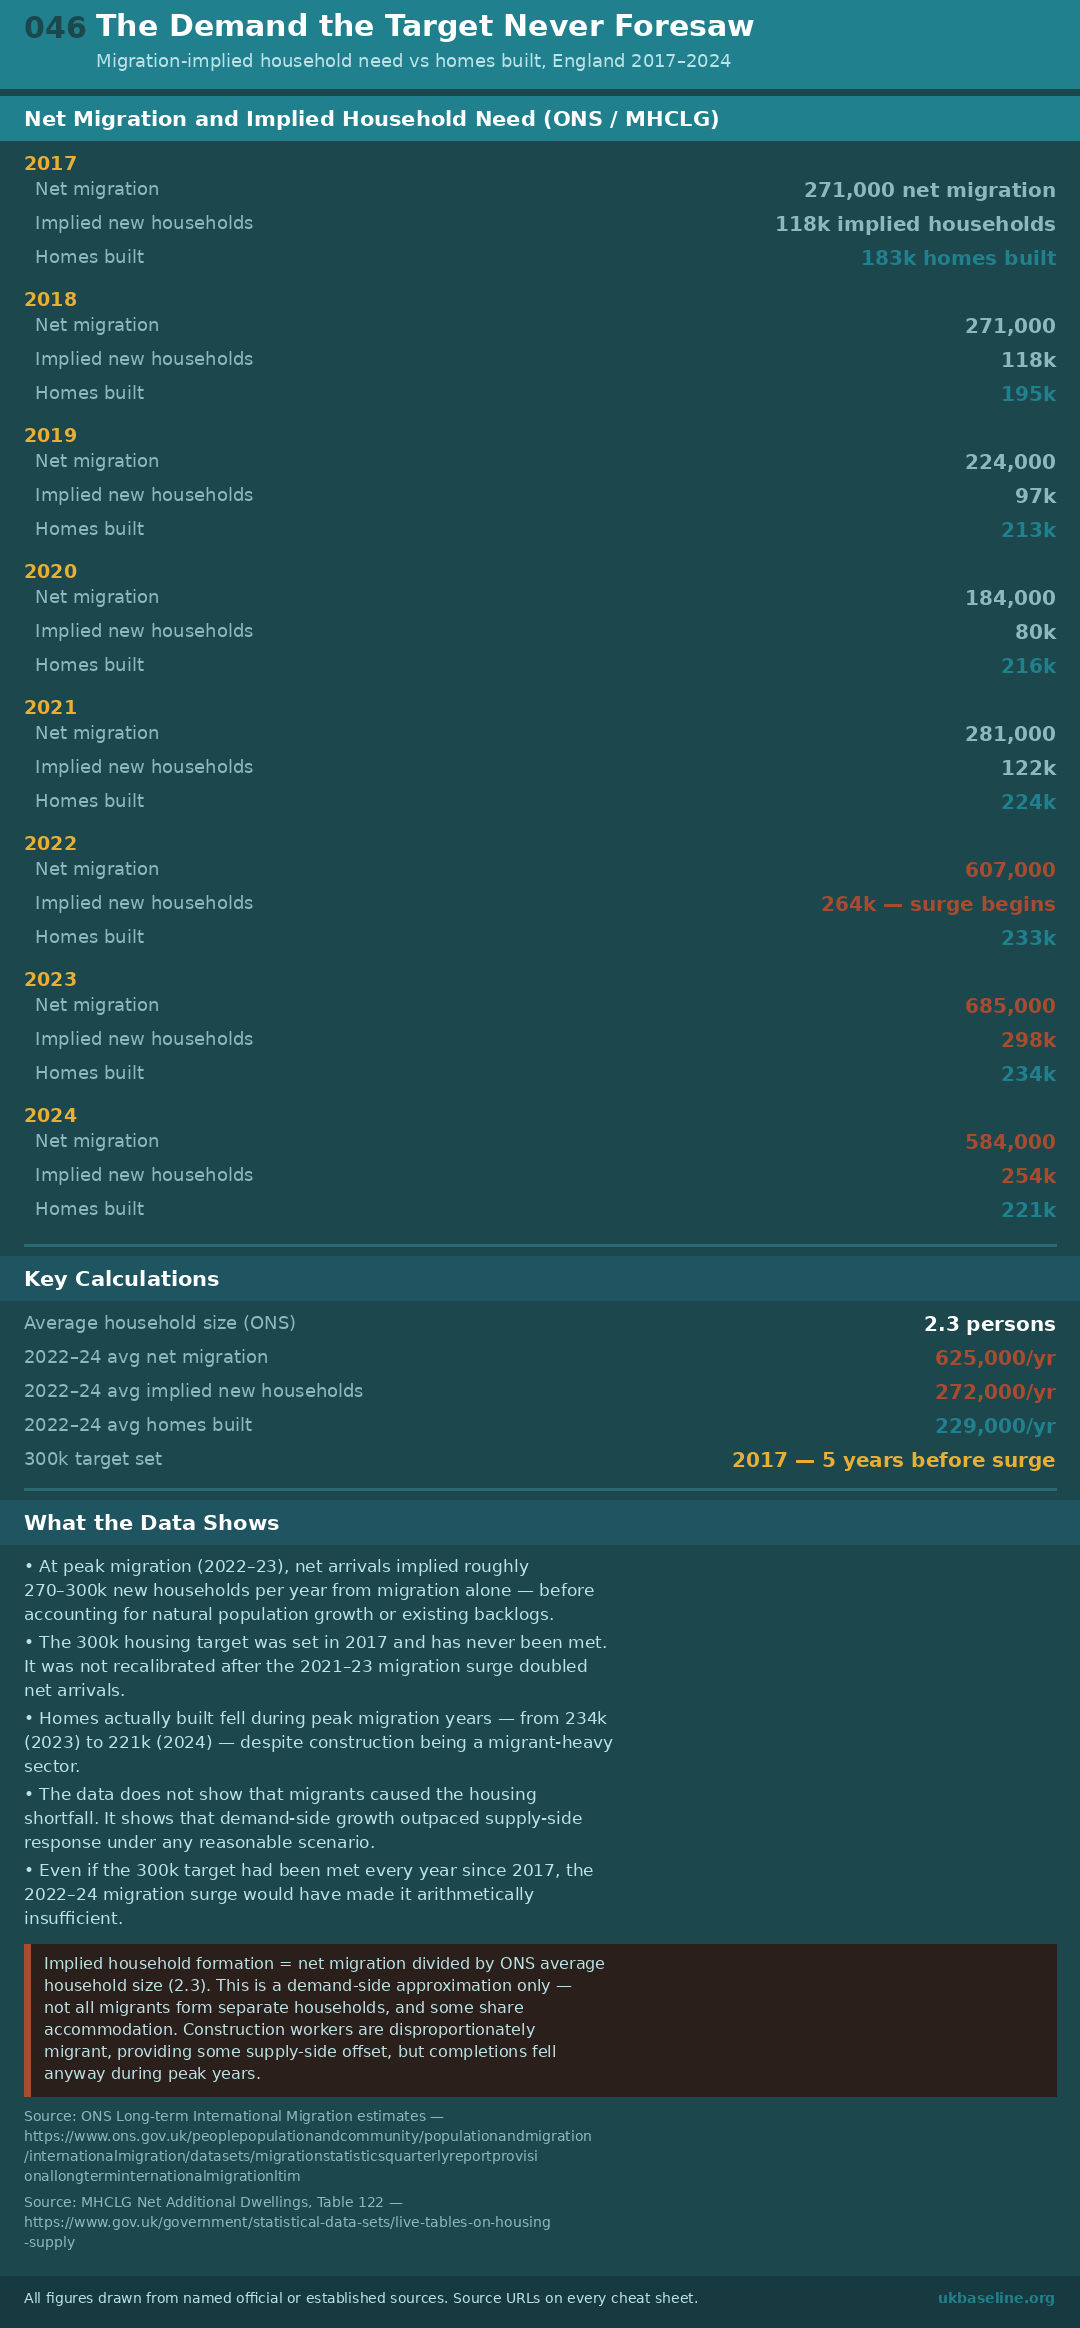
Implied household formation divides net migration by ONS average household size (2.3 persons). This is an approximation — not all migrants form separate households. Construction is a migrant-heavy sector, providing some supply-side offset. However, completions fell during peak migration years, suggesting planning and financing constraints were the binding constraint on supply, not labour availability. This graphic shows a demand-side pressure; it does not claim migration caused the housing crisis.
Sources
- MHCLG (formerly DLUHC) — Housing supply: net additional dwellings, England — gov.uk
- ONS — House Price Index (HPI), UK — ons.gov.uk
- ONS — Housing affordability in England and Wales — ons.gov.uk
- MHCLG — Right to Buy: sales, receipts and additional homes statistics — gov.uk
- MHCLG — Planning applications in England: quarterly release — gov.uk
- MHCLG — Statutory homelessness in England: quarterly release — gov.uk
- MHCLG — Help to Buy: Equity Loan scheme statistics — gov.uk
- ONS — Long-term international migration, provisional — ons.gov.uk