The Small Boats Claim
Social media often claims: "Brexit caused the small boats — when we were in the EU we had no boats and an agreement to return migrants." The data tells a more complex story. Crossings began in 2018, before Brexit took legal effect. The sharpest single-year spike was in 2020 — while the UK was still inside Dublin III. And Dublin was not a mechanism that kept the UK clear: the UK was a net importer of asylum seekers under it. Six graphics. The data only.
Brexit is a plausible contributing factor to the boats — loss of Dublin/Eurodac access and potential signalling effects are legitimate arguments. The data does not allow us to quantify its role precisely. What the data does show clearly is that COVID-19 and the hardening of Calais lorry routes are better-evidenced as the 2020 trigger. The Dublin "returns agreement" existed but was small-scale, reciprocal, and the UK was a net importer under it. Both claims — "Brexit caused it" and "Dublin kept us safe" — are substantially misleading when stated without this context.
When Did the Boats Start?
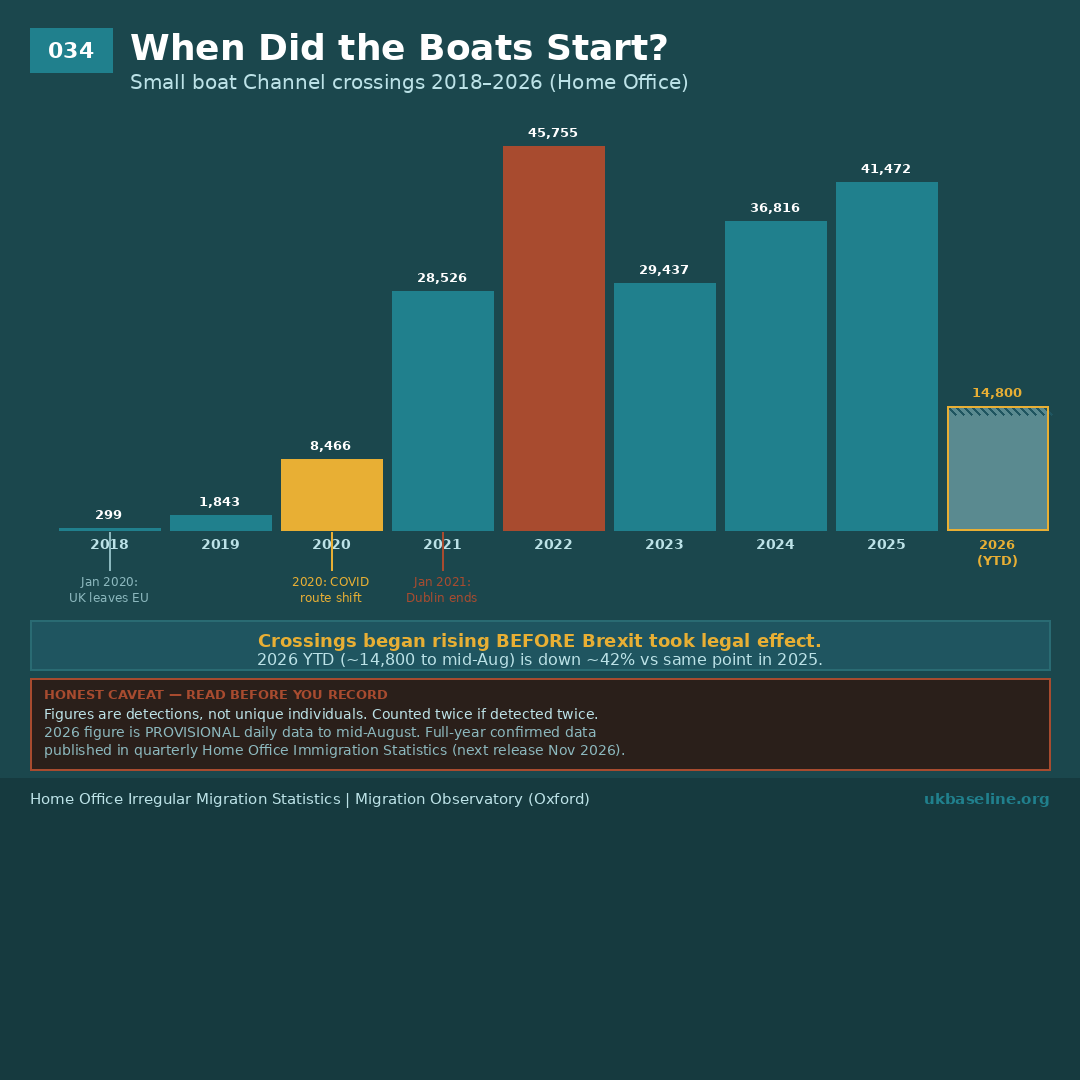
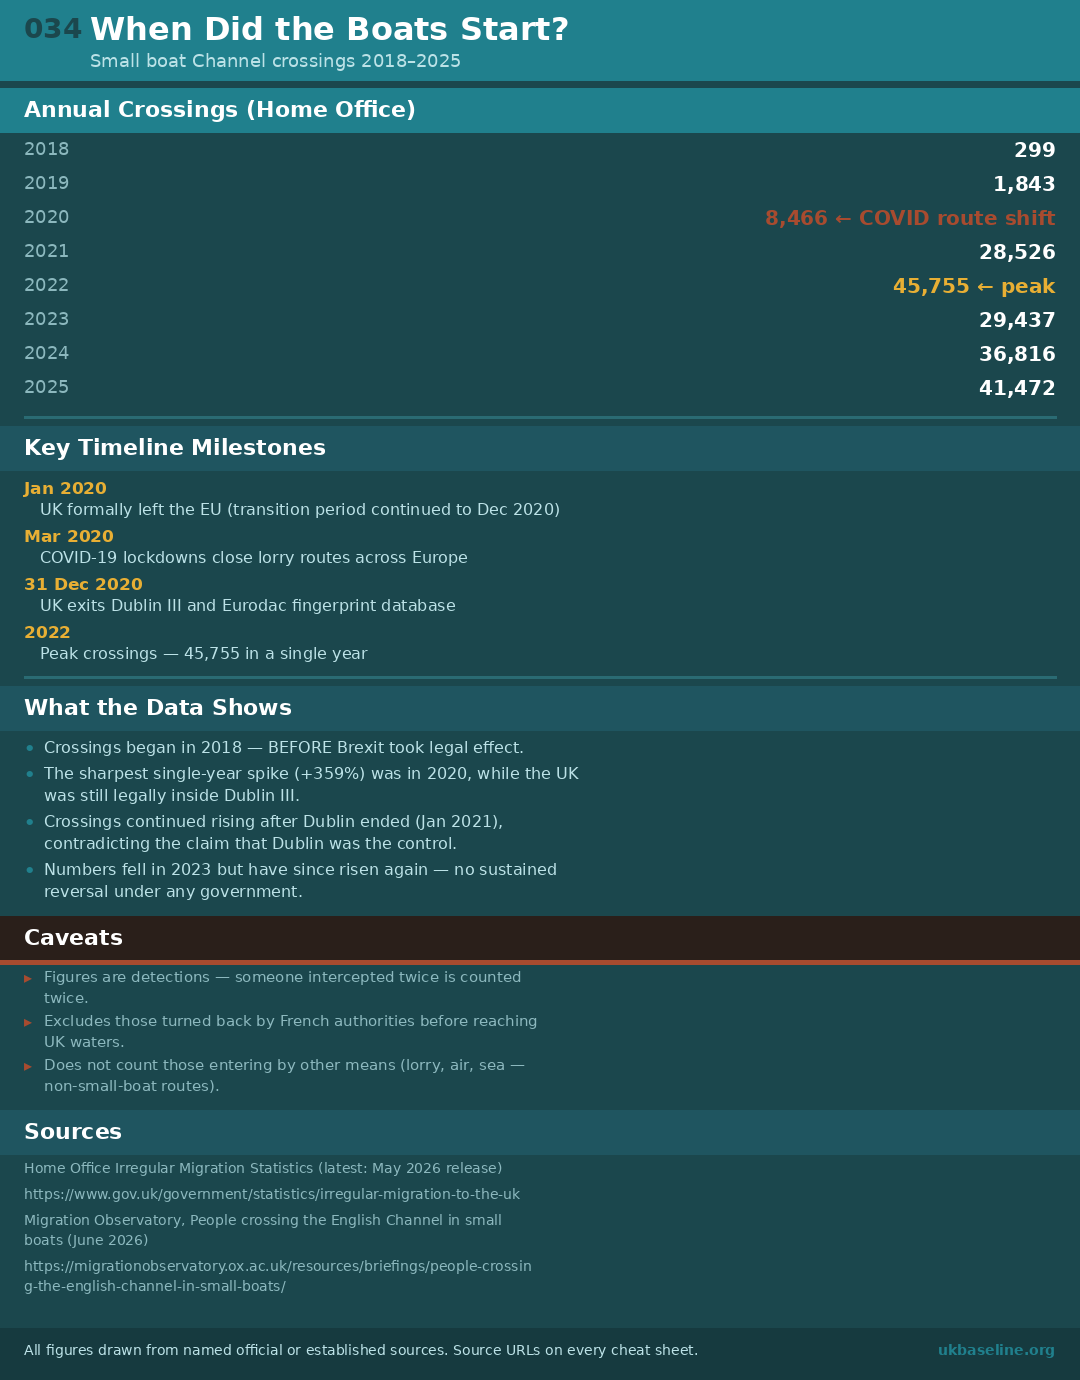
Annual small boat Channel crossings 2018–2025. Crossings began in 2018 — before Brexit took legal effect. The sharpest single-year spike (+359%) occurred in 2020, while the UK was still inside the Dublin system. Numbers fell in 2023 before rising again; no government has achieved a sustained reversal.
Before Boats, There Were Lorries
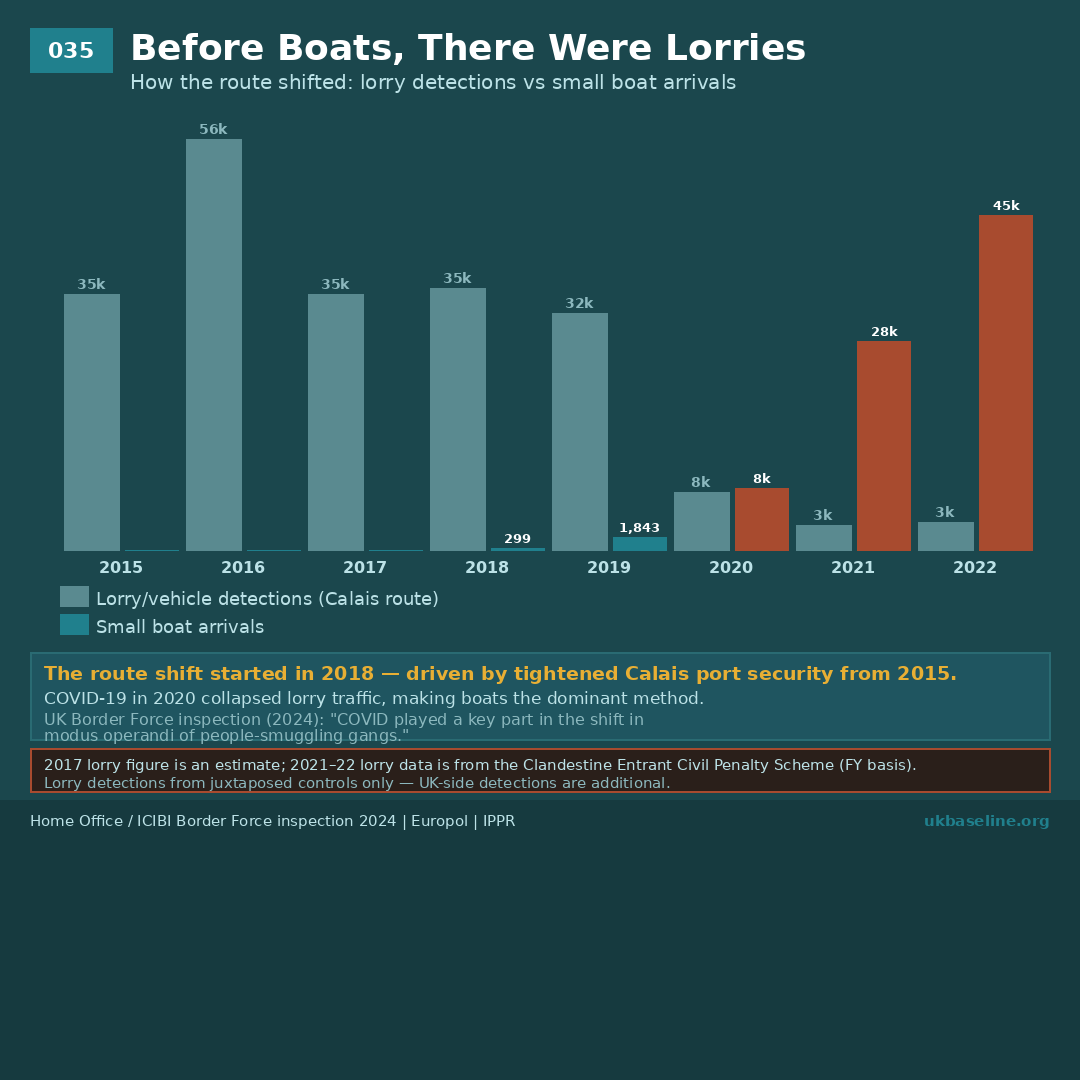
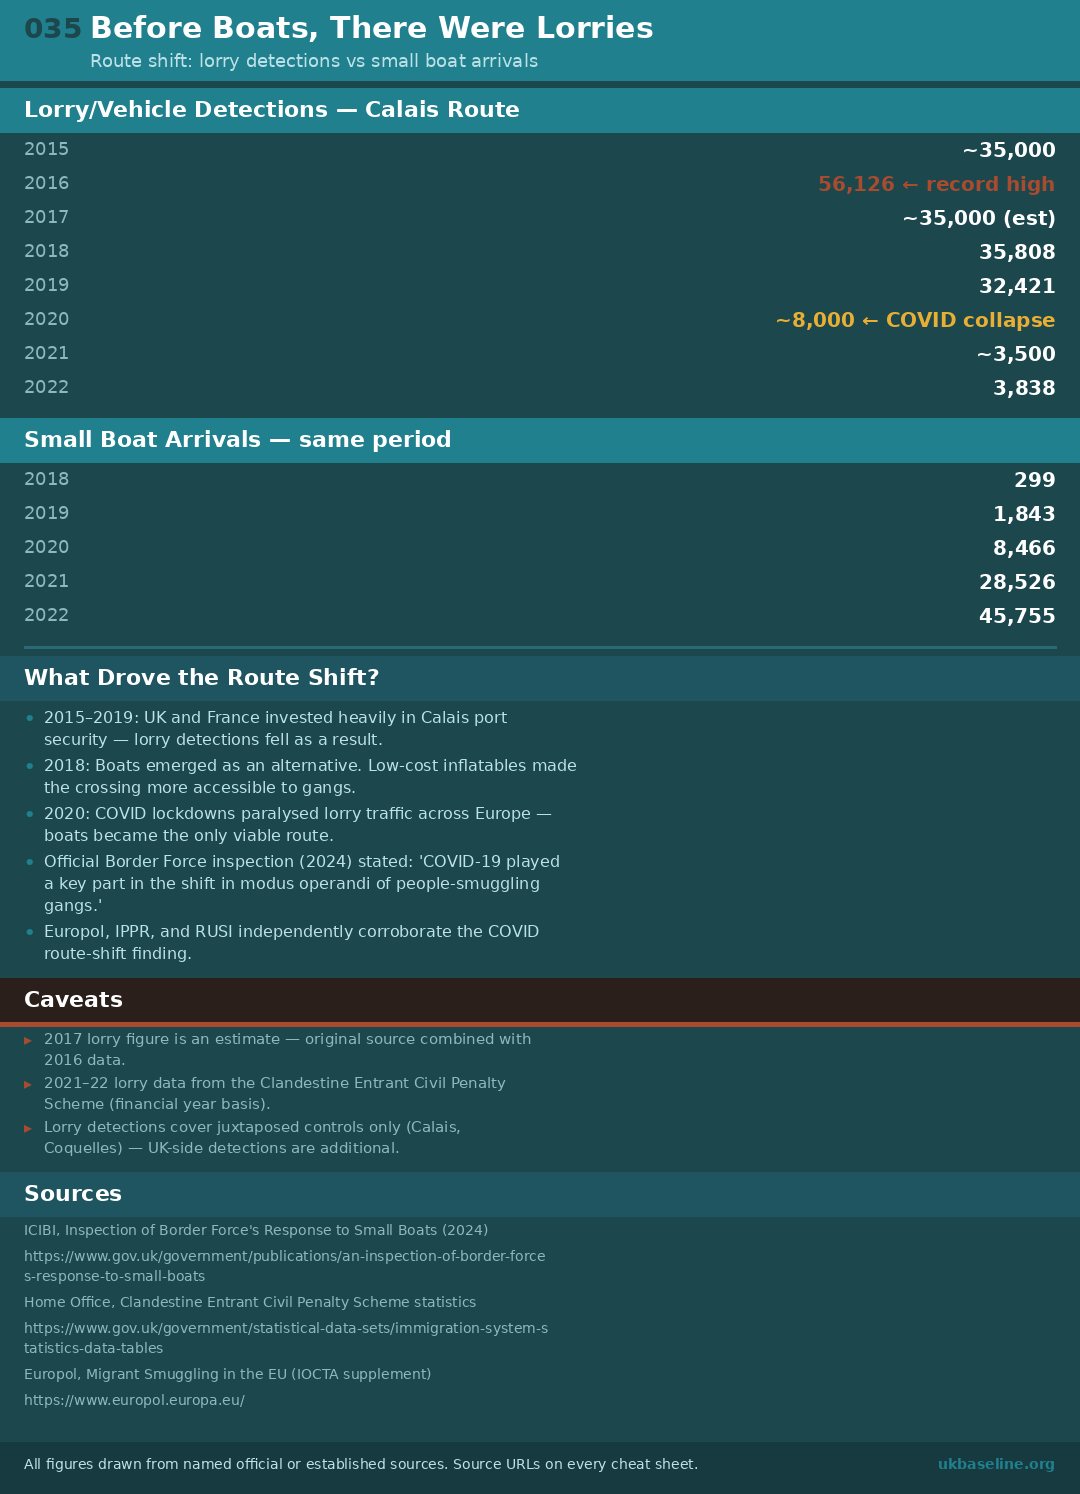
Lorry and vehicle detections at Calais peaked at 56,126 in 2016 and fell steadily as port security tightened. Small boats emerged in 2018 as gangs adapted. COVID-19 in 2020 collapsed lorry traffic entirely — making boats the only viable route. The UK Border Force's own inspection (2024) states COVID "played a key part in the shift in modus operandi."
What Dublin Actually Did
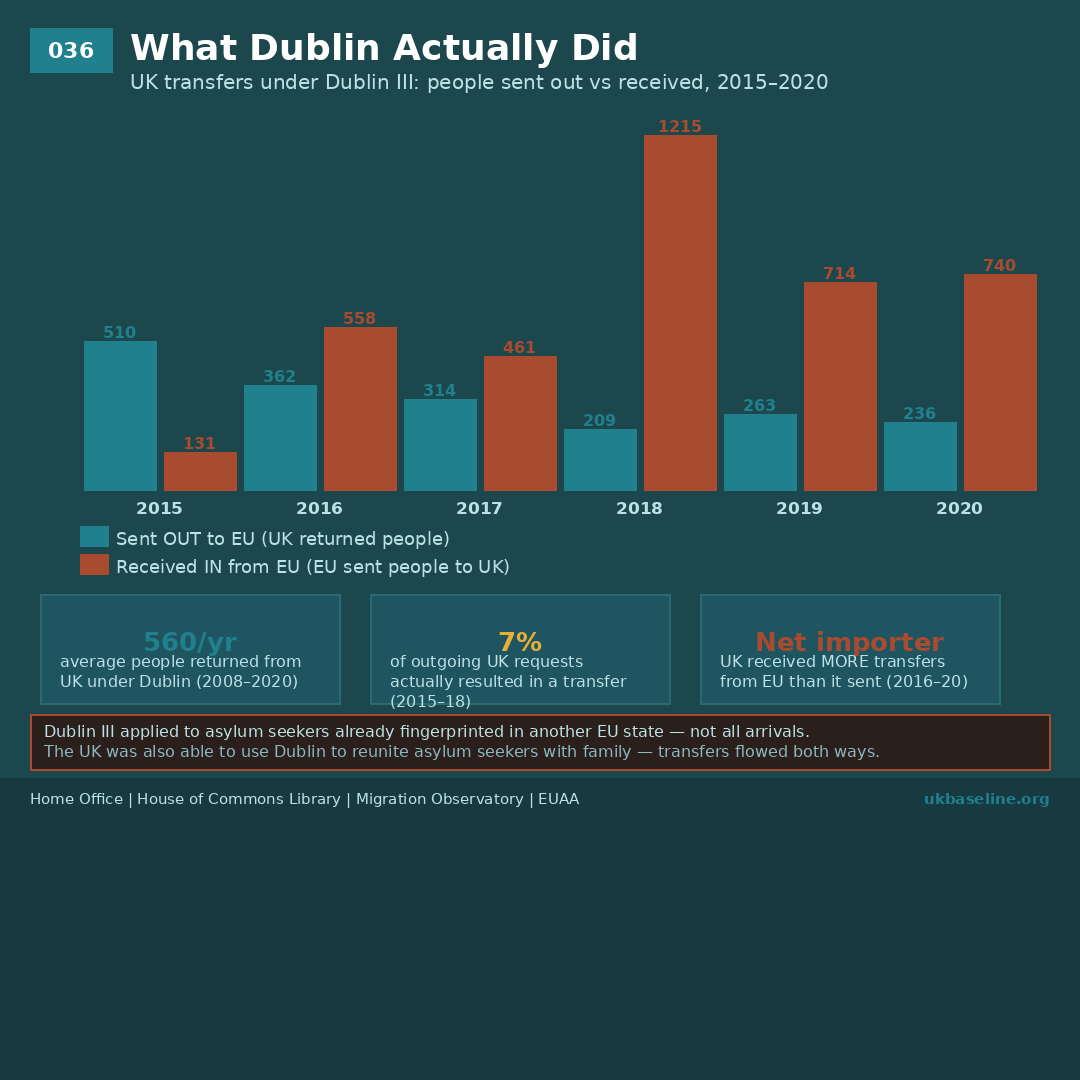
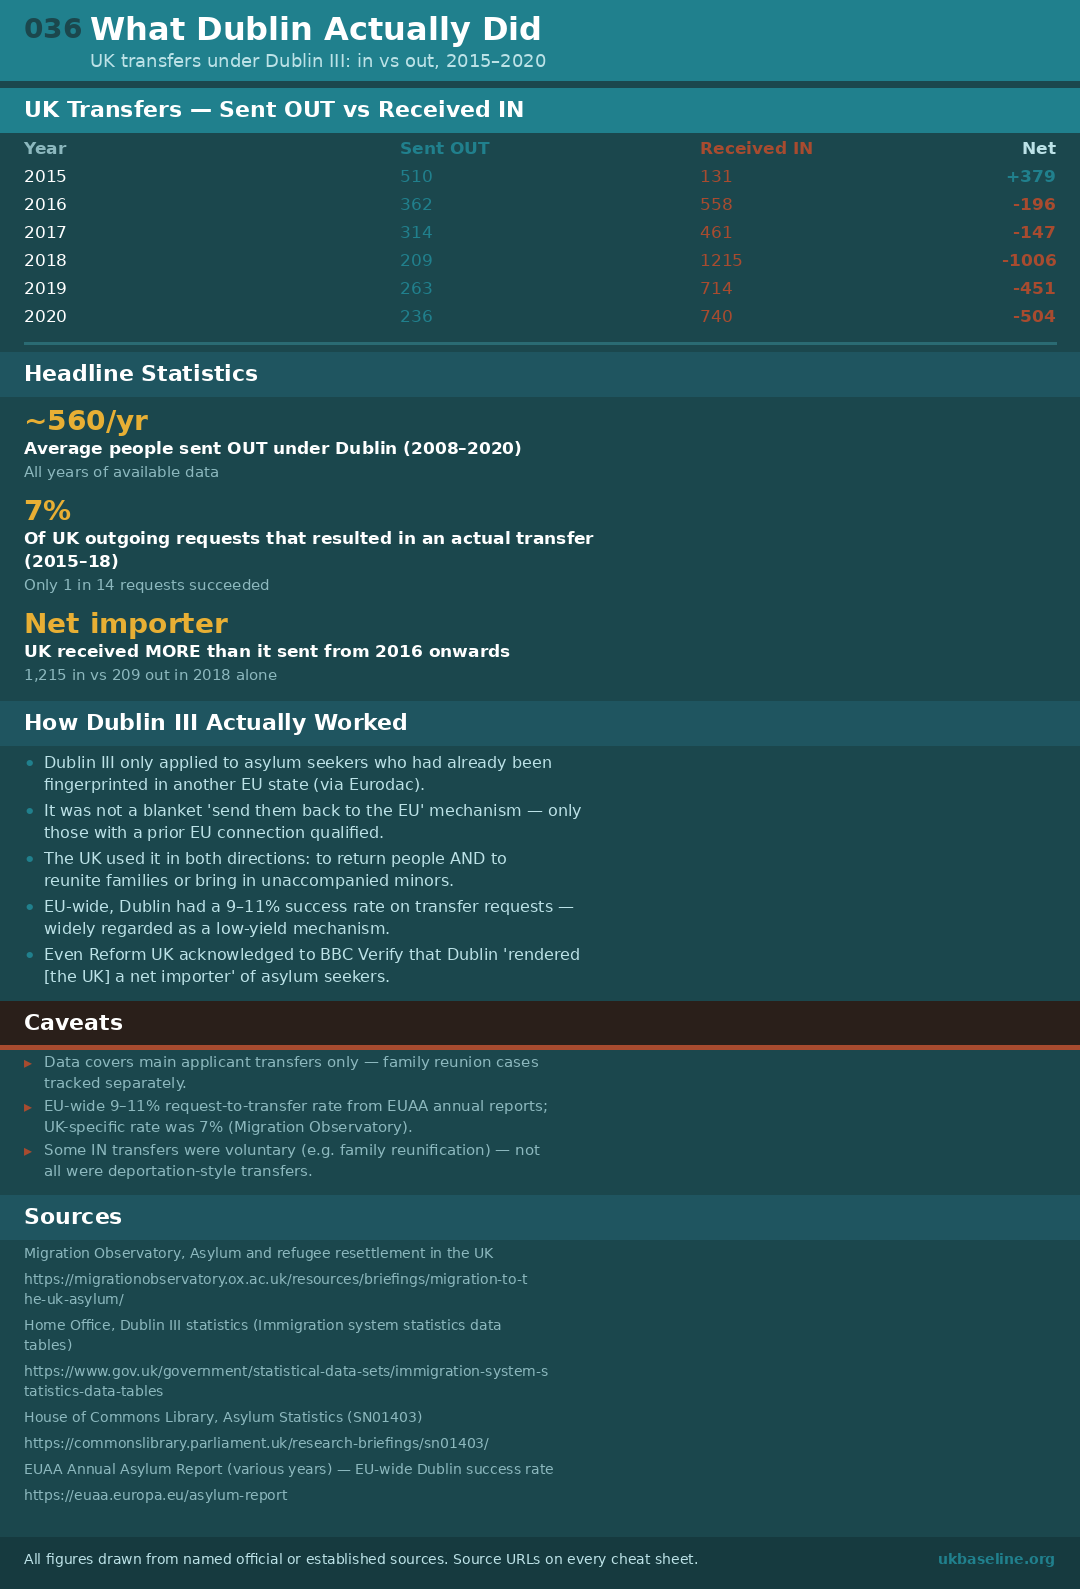
UK transfers under Dublin III, 2015–2020: people sent out to EU vs received in from EU. The UK averaged ~560 returns per year under Dublin across the whole period (2008–2020). Only 7% of outgoing UK requests resulted in an actual transfer. From 2016 onwards the UK was a net importer — receiving more transfers from the EU than it sent. In 2018: 1,215 people received vs 209 sent out.
What Replaced Dublin
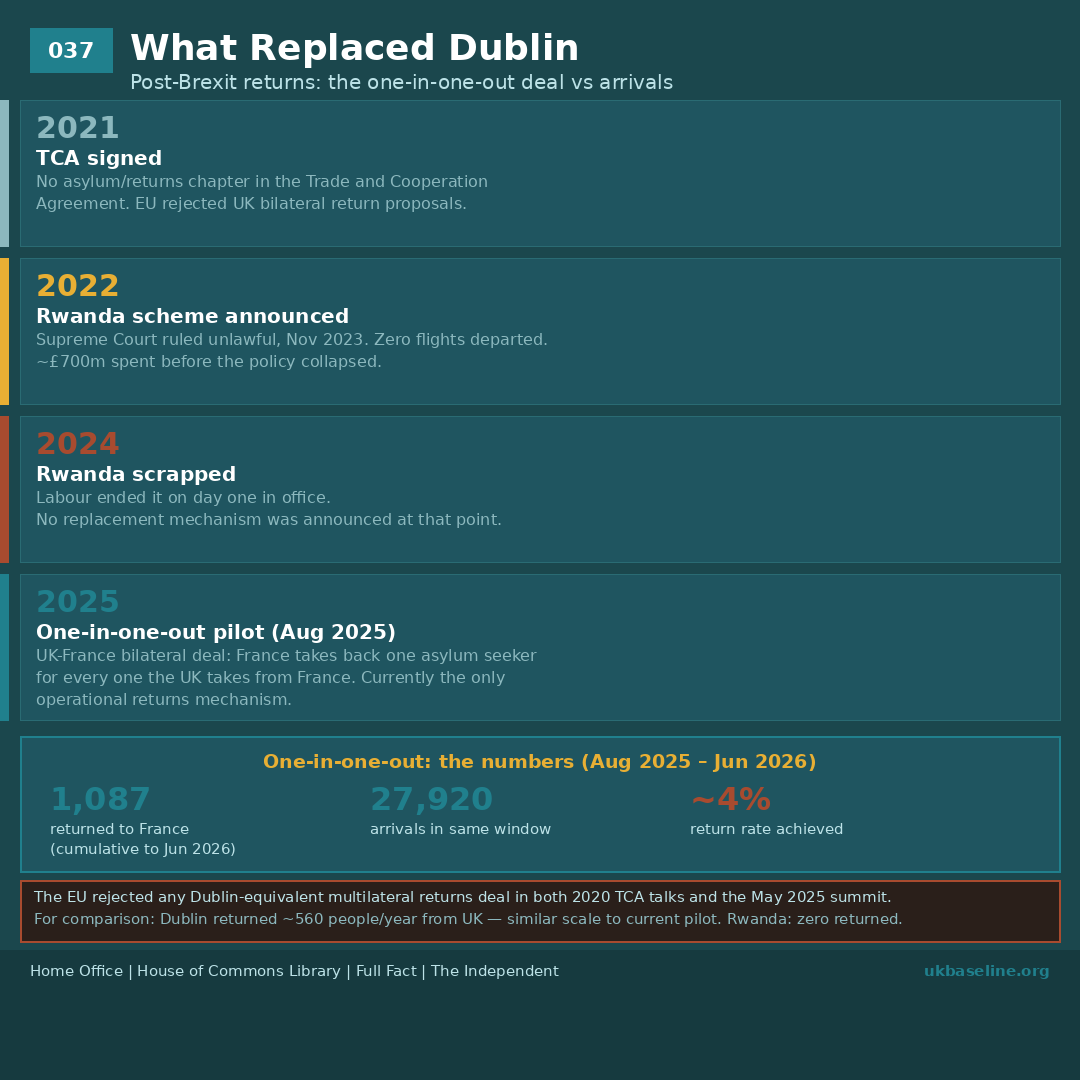
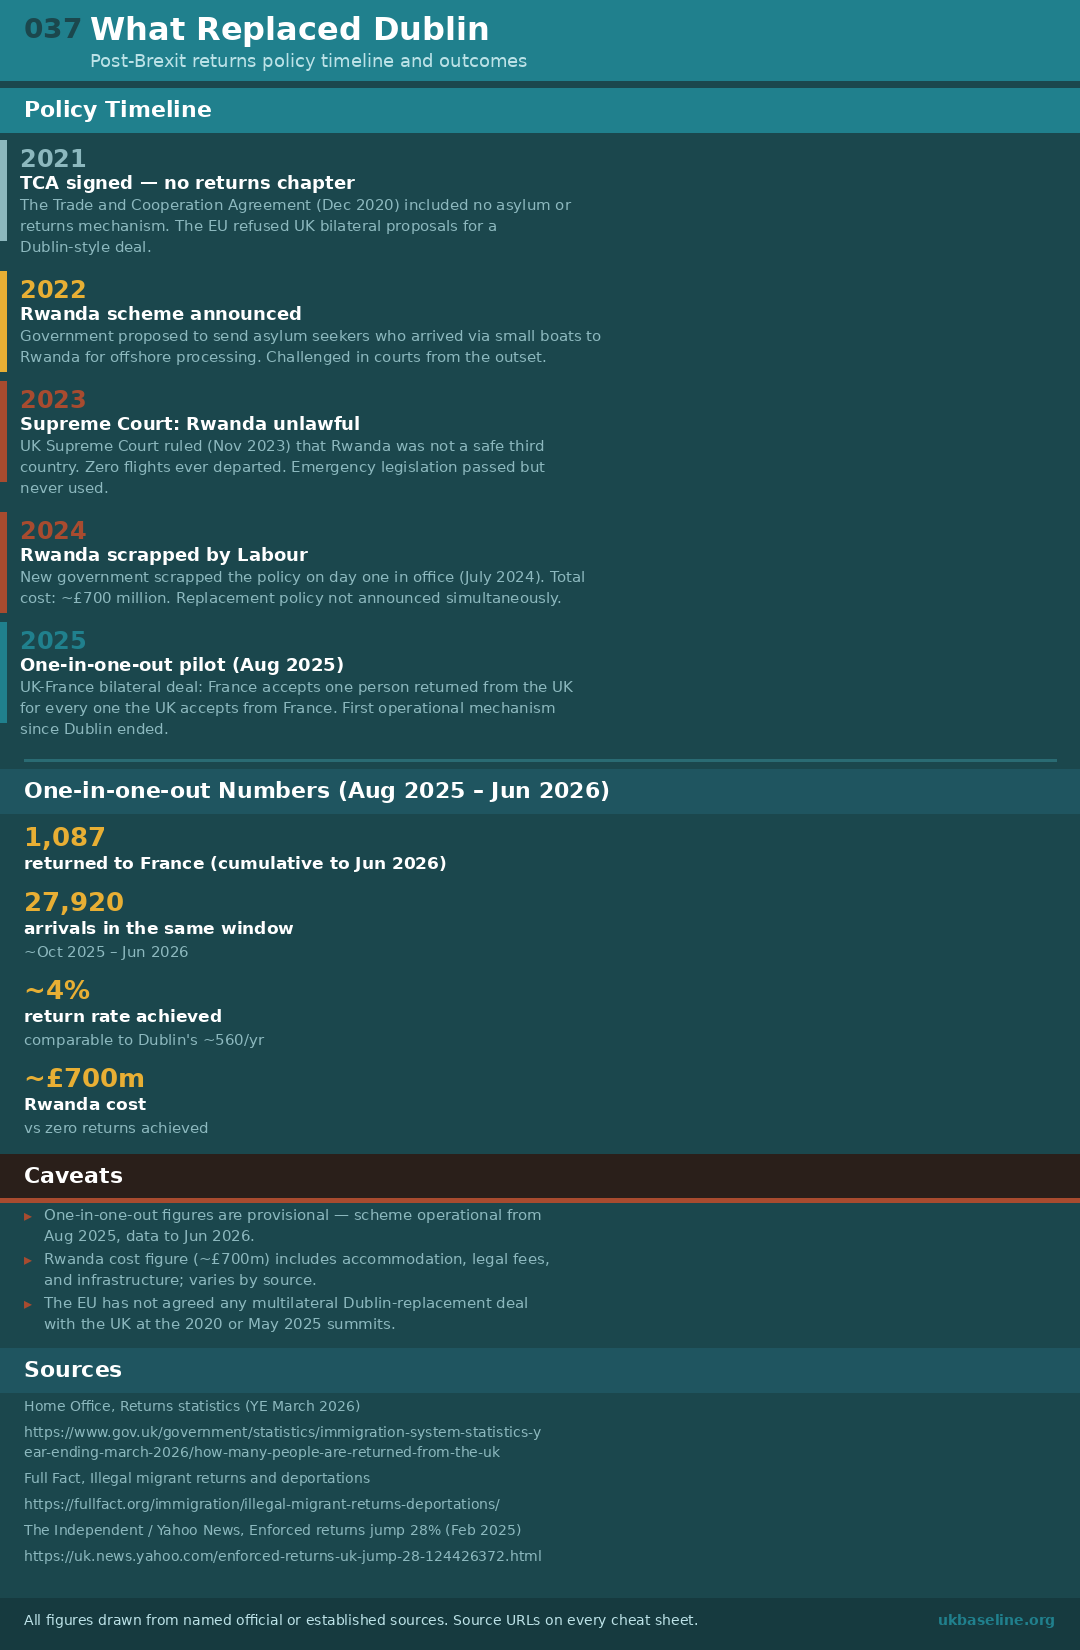
The 2020 Trade and Cooperation Agreement included no asylum or returns mechanism. The Rwanda scheme (2022–2024) cost ~£700m and sent zero flights. The current one-in-one-out pilot with France (August 2025) has returned 1,087 people against 27,920 arrivals — a ~4% return rate comparable to what Dublin achieved. The EU has declined to agree any Dublin-equivalent multilateral deal at every negotiation since 2020.
What Happened to Them?
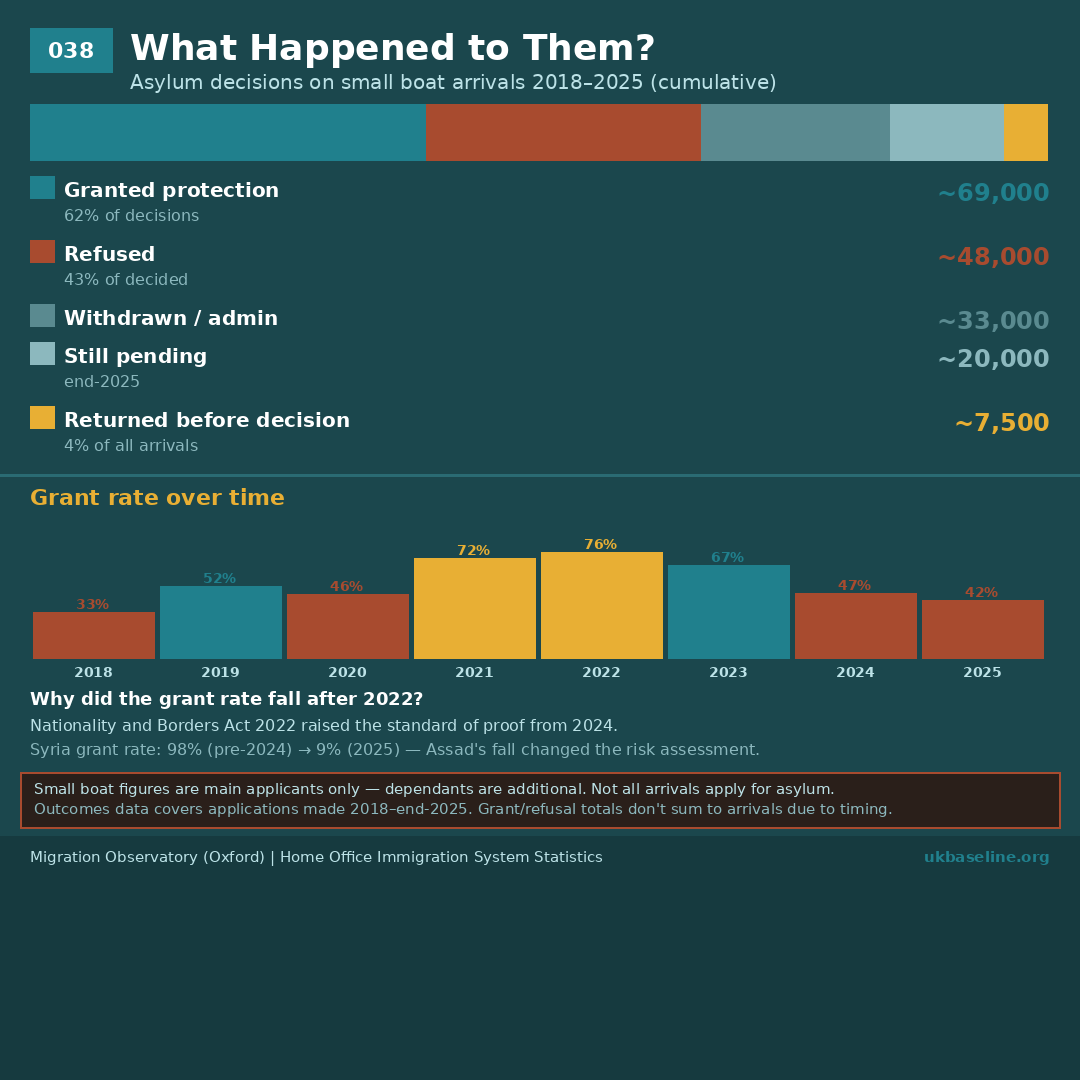
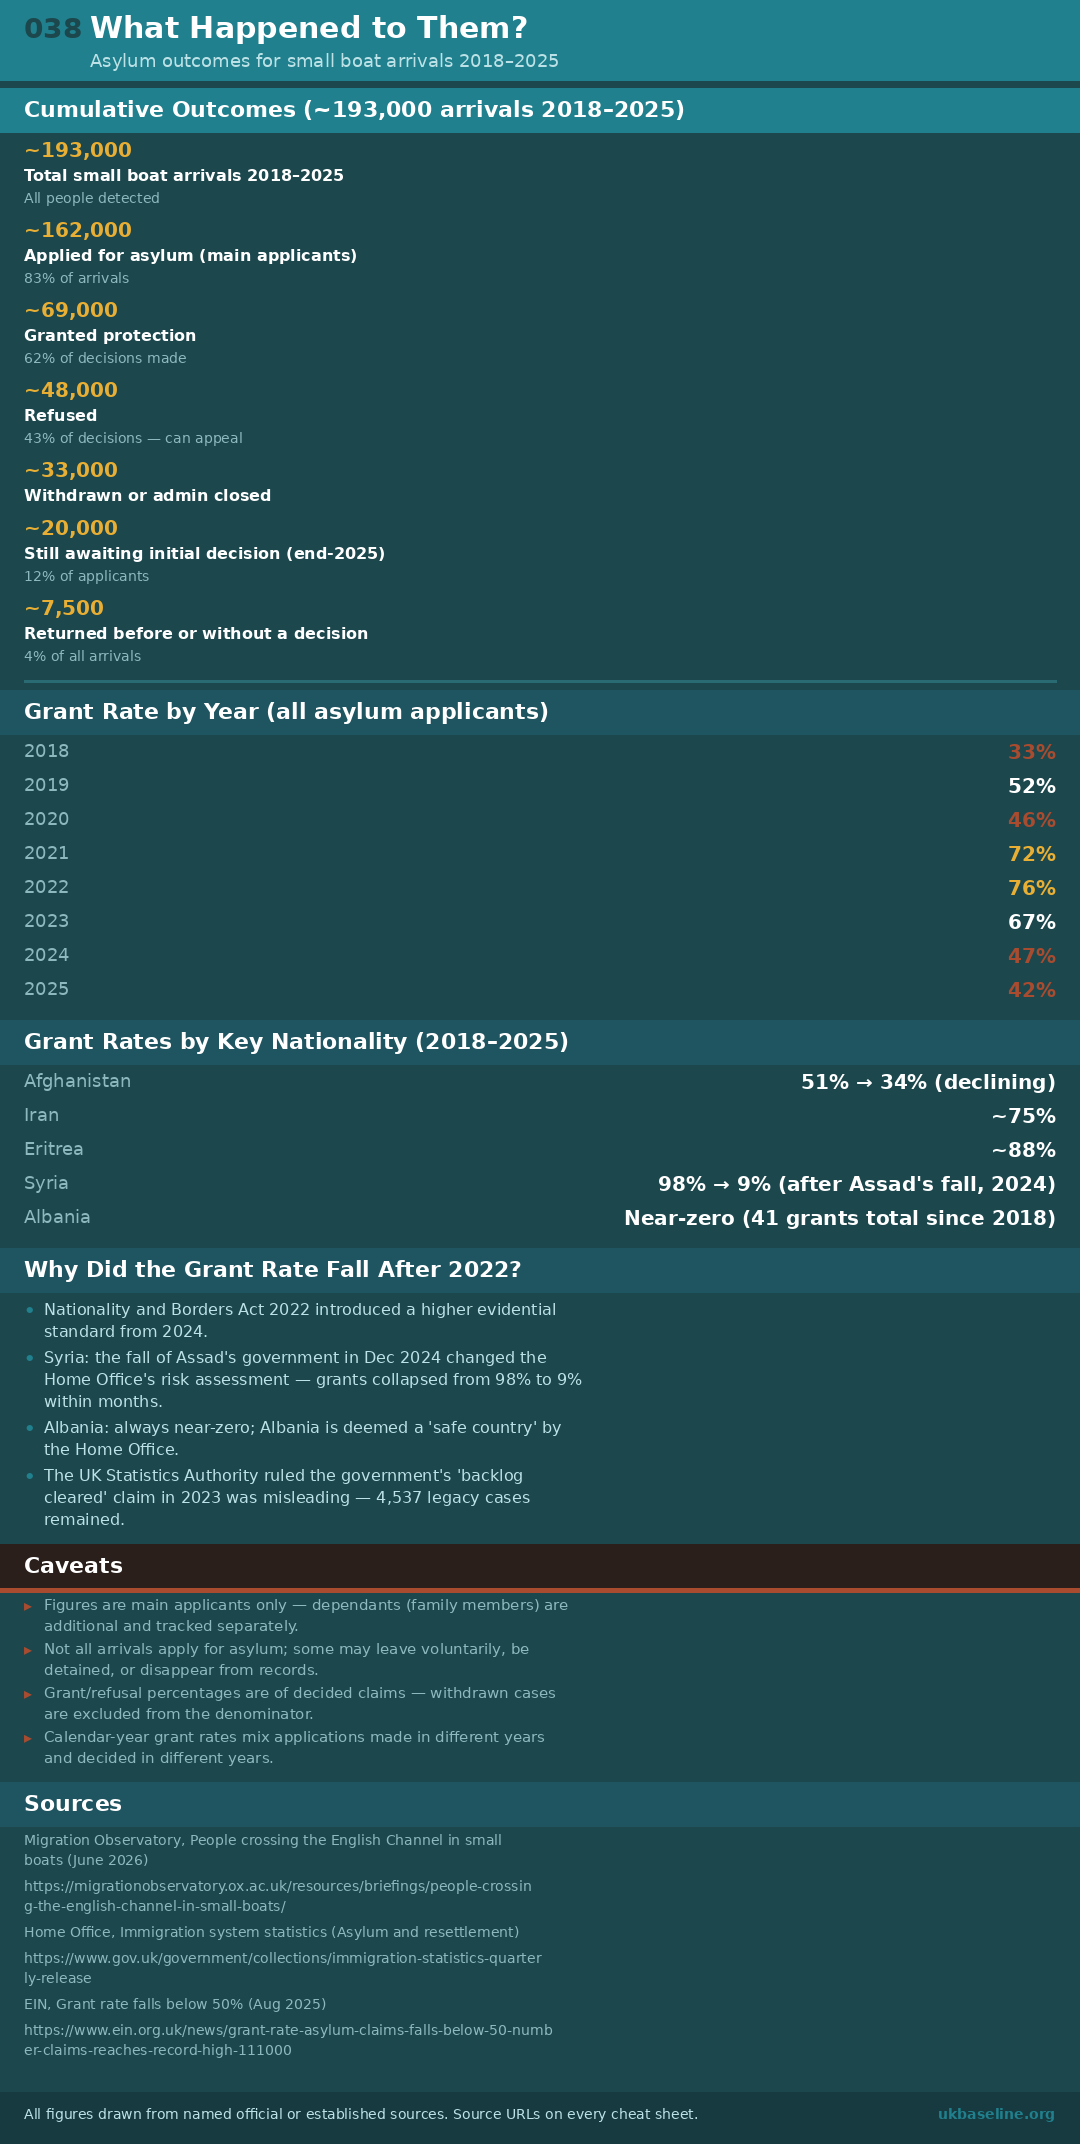
Of ~193,000 small boat arrivals 2018–2025, approximately 162,000 applied for asylum. Of those with a decision: ~69,000 (62%) were granted protection; ~48,000 refused. Around 20,000 were still awaiting an initial decision at end-2025. The overall grant rate rose from 33% in 2018 to 76% in 2022, then fell to 42% in 2025 following the Nationality and Borders Act 2022 raising the standard of proof.
Returns: The Full Picture
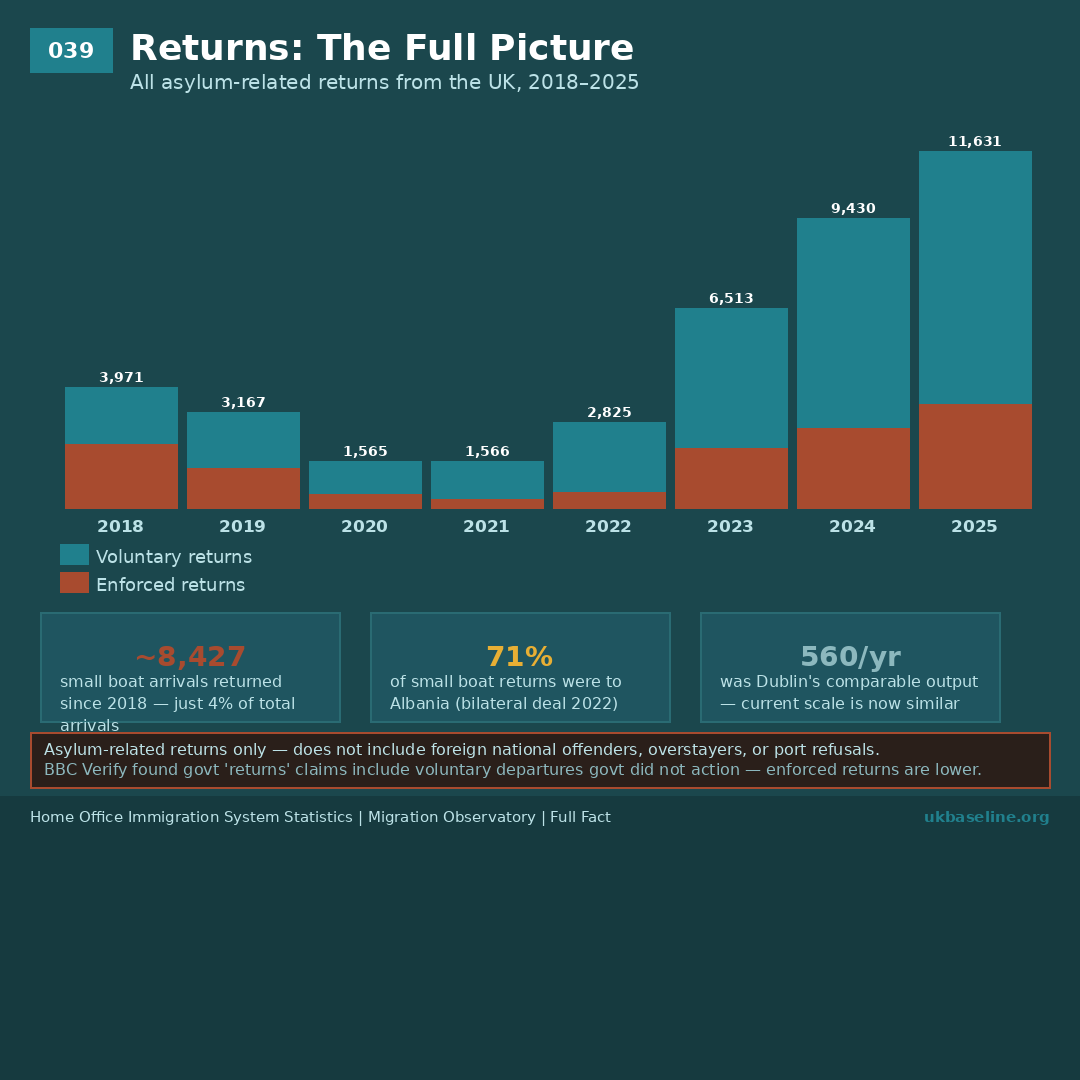
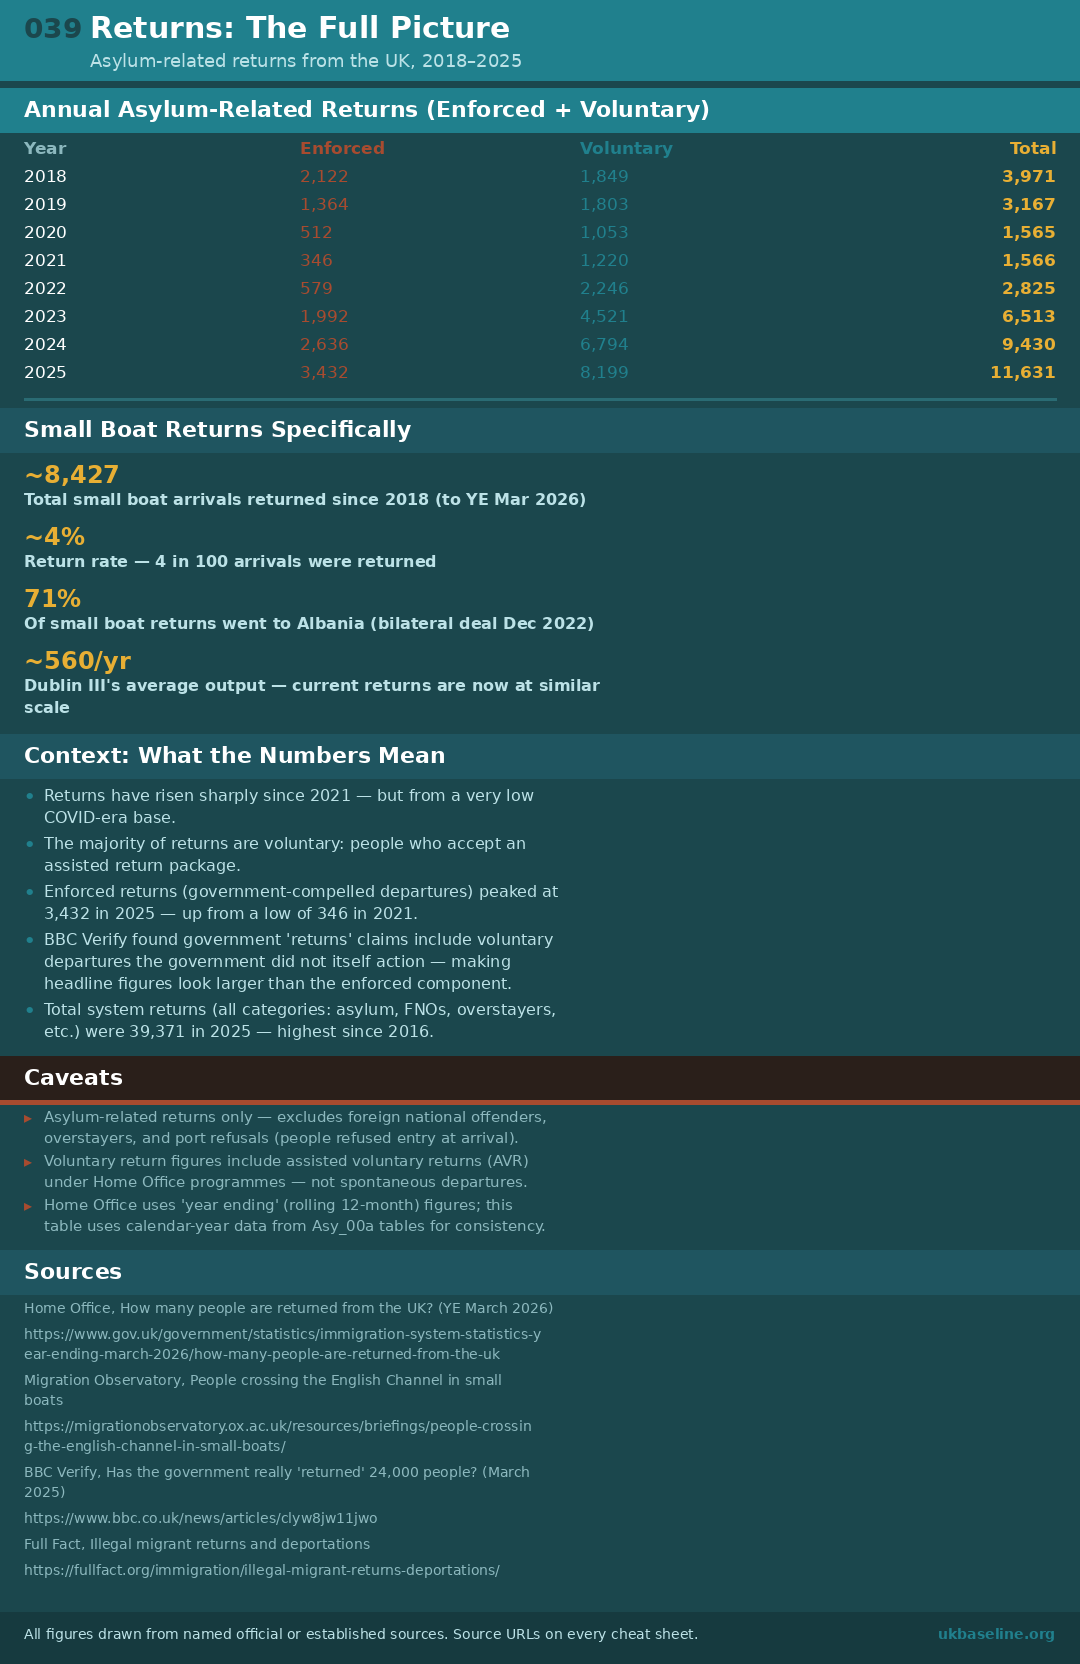
Asylum-related returns (enforced and voluntary) from the UK, 2018–2025. Returns collapsed during COVID and have risen since — reaching 11,631 in 2025. Of all small boat arrivals since 2018, ~8,427 have been returned (4%). Of these, 71% went to Albania under the bilateral deal signed in December 2022. BBC Verify found government "returns" claims include voluntary departures the government did not itself action — making headline figures larger than the enforced component.
Sources
- Home Office — Migrants detected crossing the English Channel in small boats — gov.uk
- Home Office — Immigration System Statistics, quarterly release — gov.uk
- Home Office — Asylum and resettlement datasets — gov.uk
- National Crime Agency — Operation Gull / clandestine lorry detection statistics — nationalcrimeagency.gov.uk
- European Council on Refugees and Exiles (ECRE) — AIDA Country Report: United Kingdom 2025 — asylumineurope.org
- Home Office — Returns and detention statistics — gov.uk