Birth Rates & Demographics — The Projections
Five graphics covering the UK's record-low fertility rate, the natural population crossover, births by mother's origin, school census composition, and the dependency ratio to 2075.
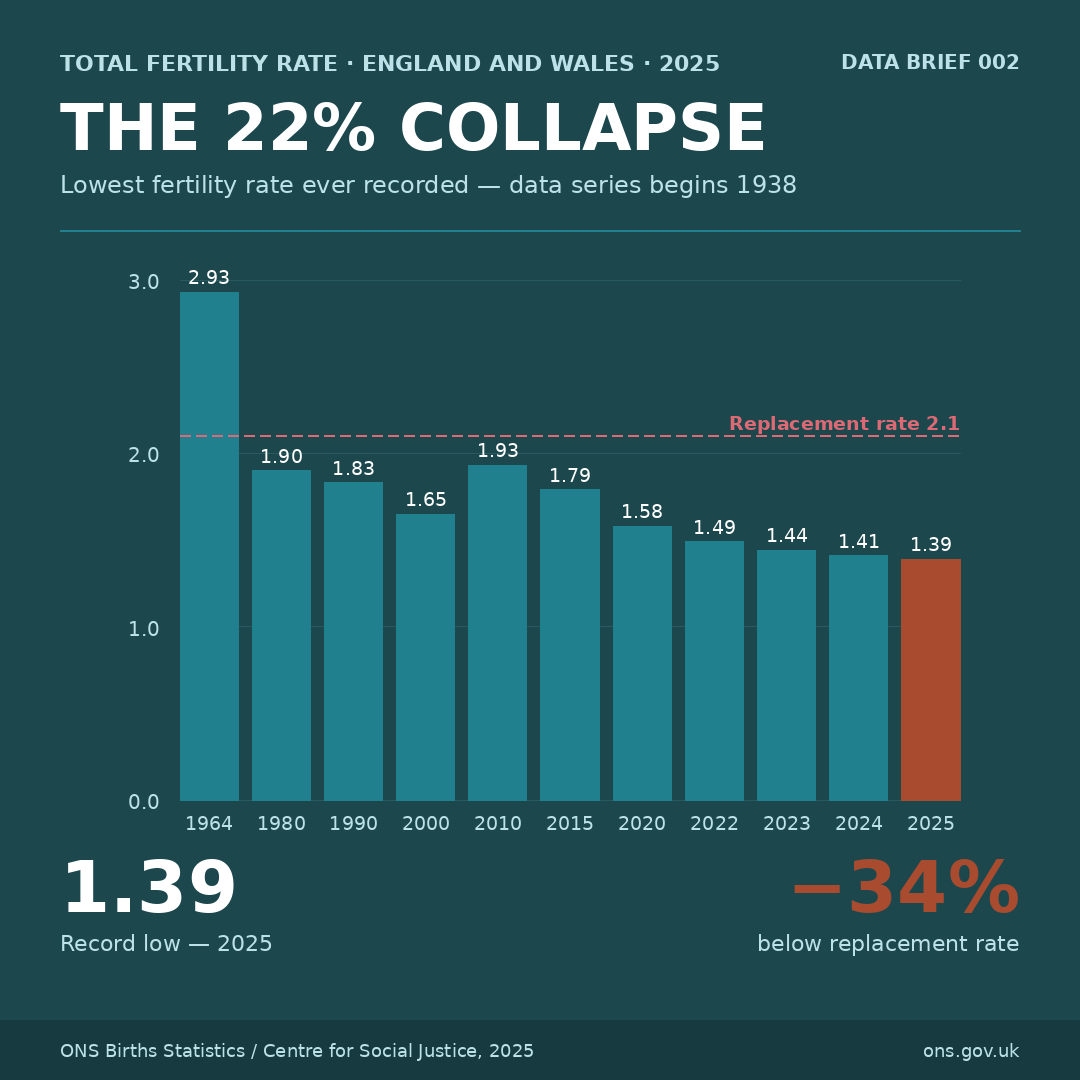
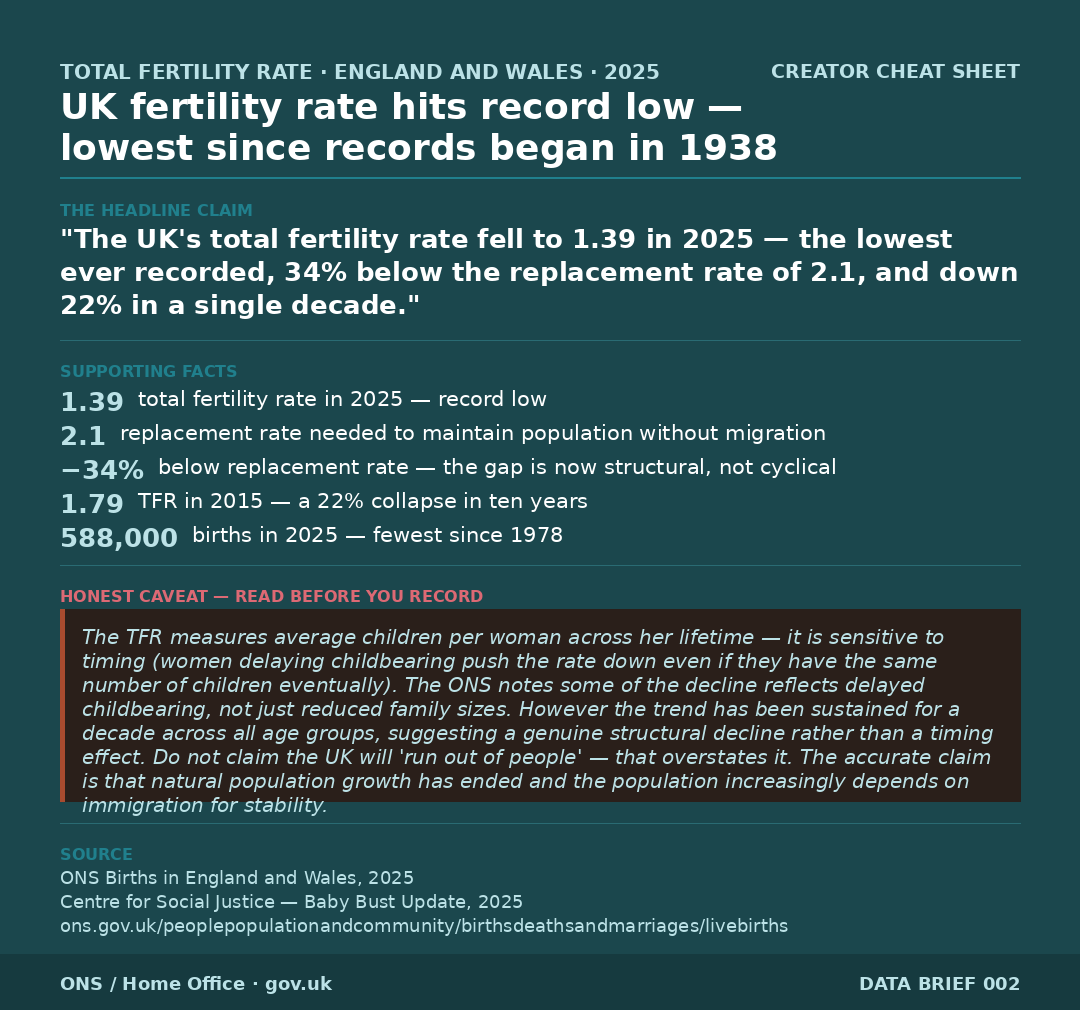
Fertility rate hits record low — TFR 1.39
The UK's total fertility rate reached 1.39 in 2025, the lowest since records began in 1938 — 34% below the 2.1 replacement rate. The long-run decline from 2.93 in 1964 leaves natural population growth impossible without sustained immigration.
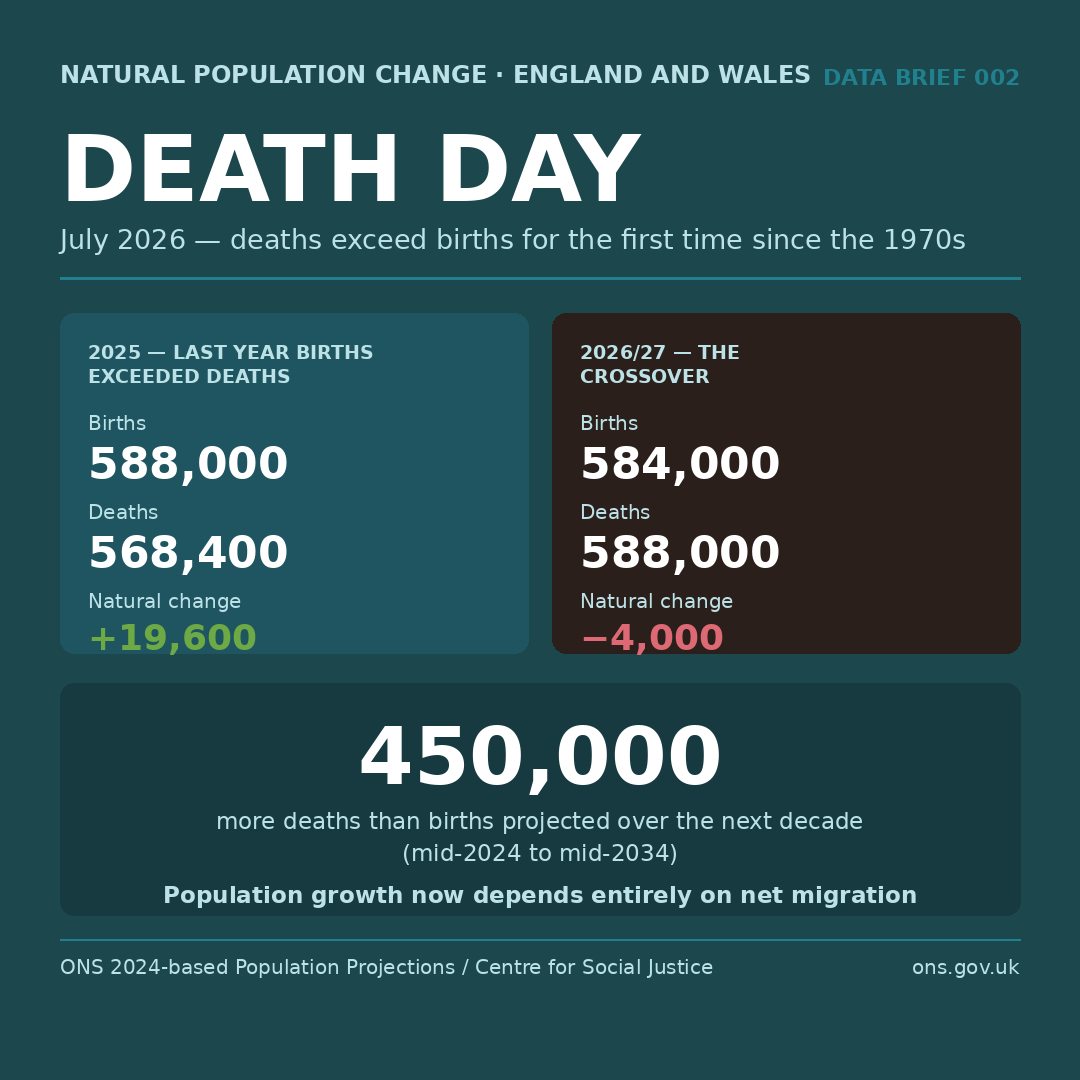
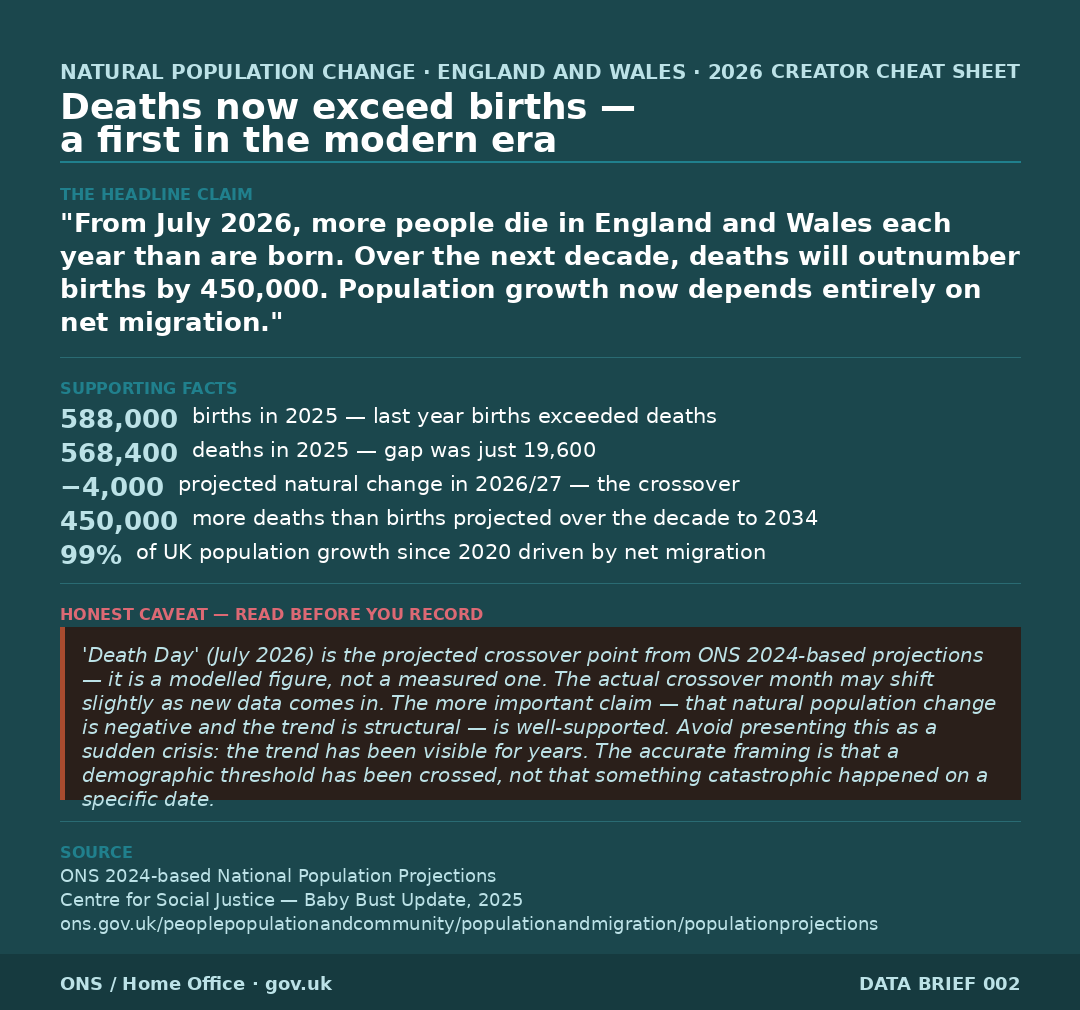
The natural population crossover — July 2026
From July 2026, deaths are projected to exceed births in England and Wales — the first sustained natural population decline in modern peacetime. The ONS projects 450,000 more deaths than births over the decade to 2034 on current trajectories.
Who is having children — births by mother's origin
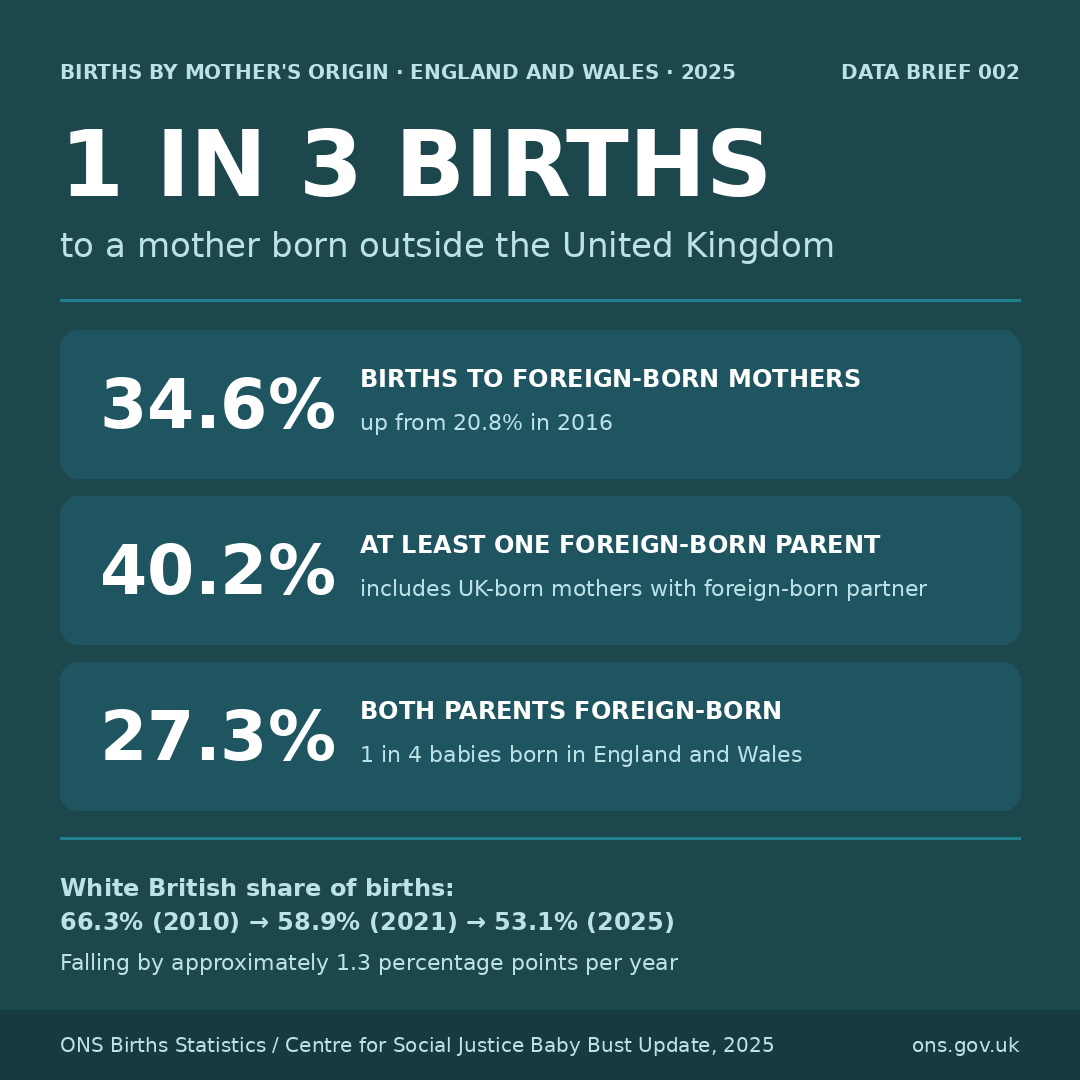
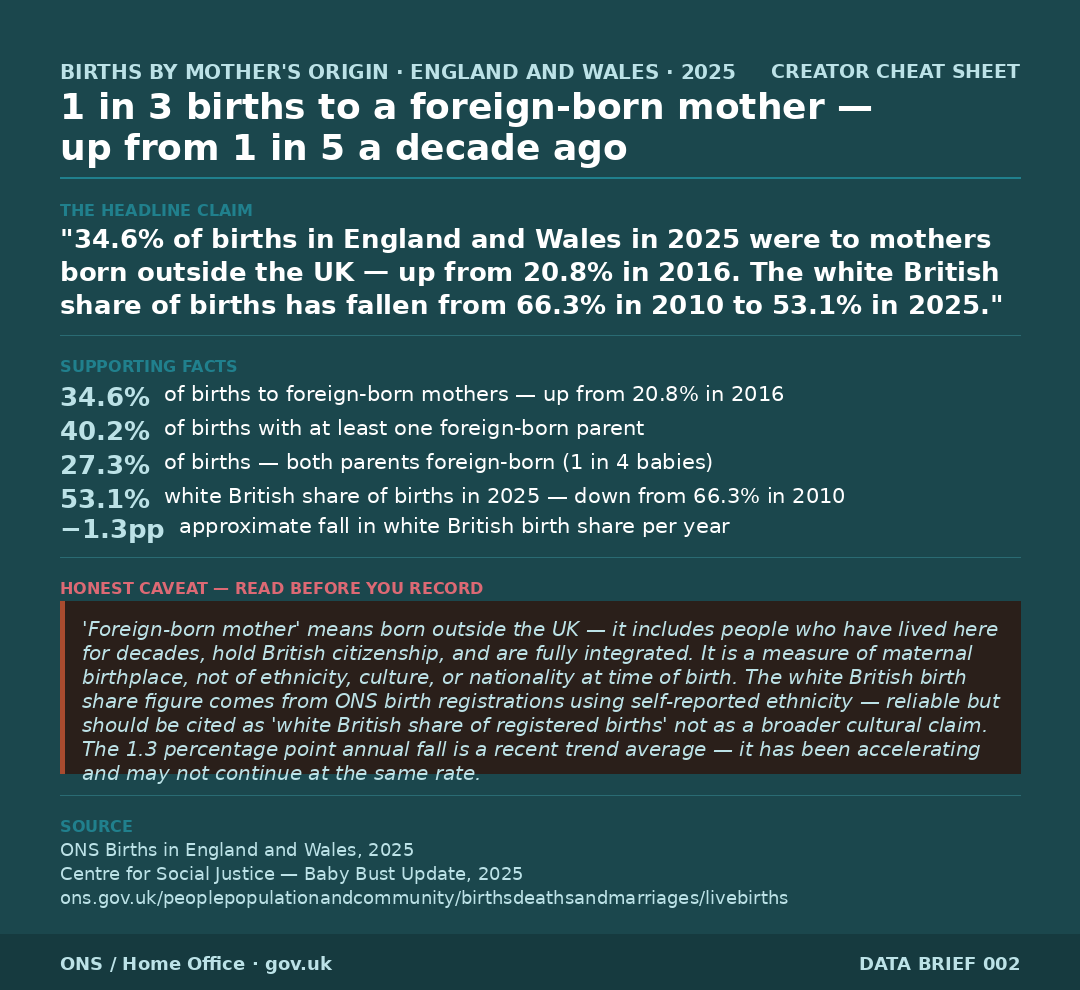
34.6% of births in England and Wales in 2025 were to foreign-born mothers — up from 20.8% in 2016. The White British share of annual births is 53.1%. The differential TFR between UK-born and foreign-born mothers is a structural driver of demographic change independent of immigration flows.
Schools are the demographic forecast
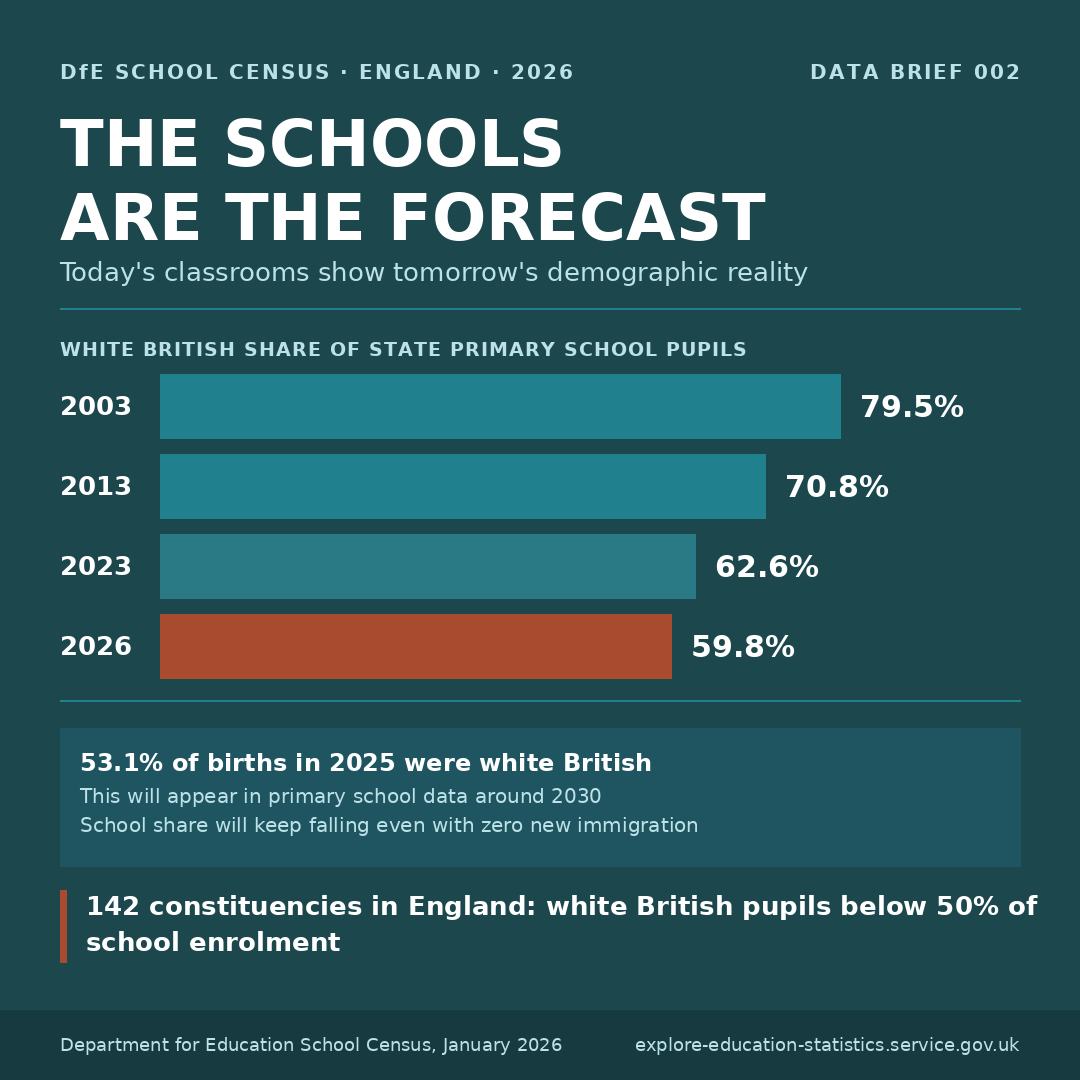
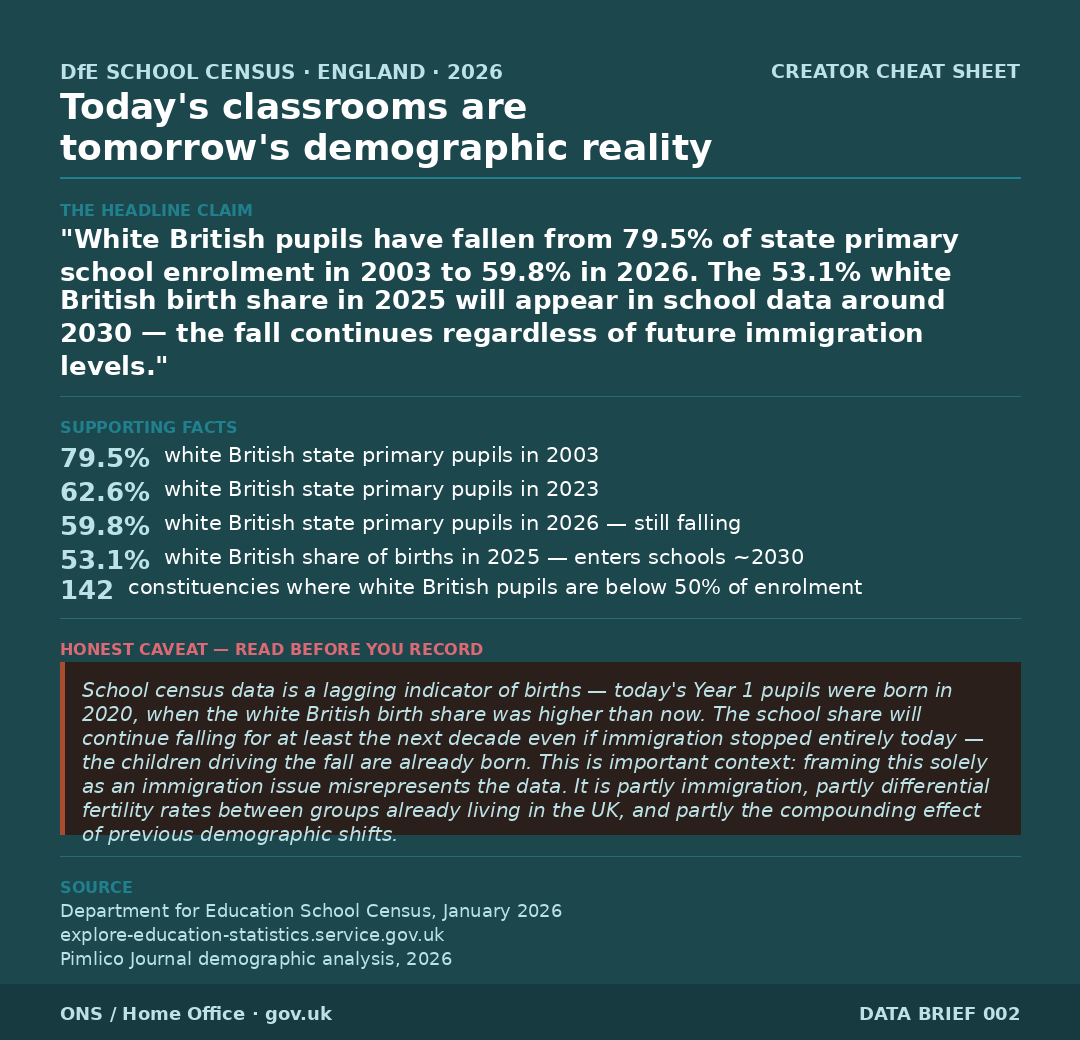
White British pupils in state primary schools: 79.5% in 2003, 59.8% in 2026. School census data is a 5-year lagging indicator of birth composition — today's classrooms reflect births from 2021, not 2026. The trend will continue regardless of future immigration levels.
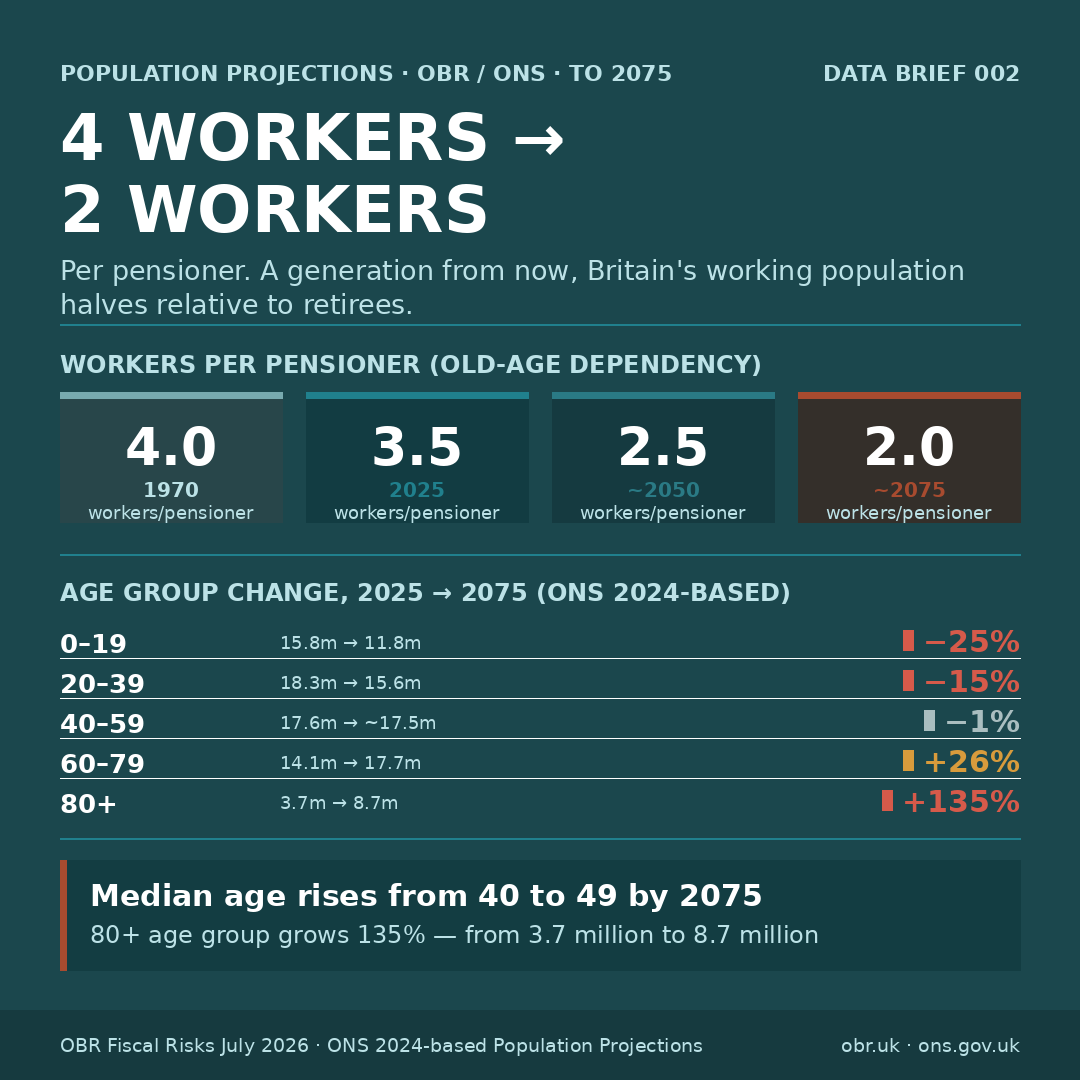
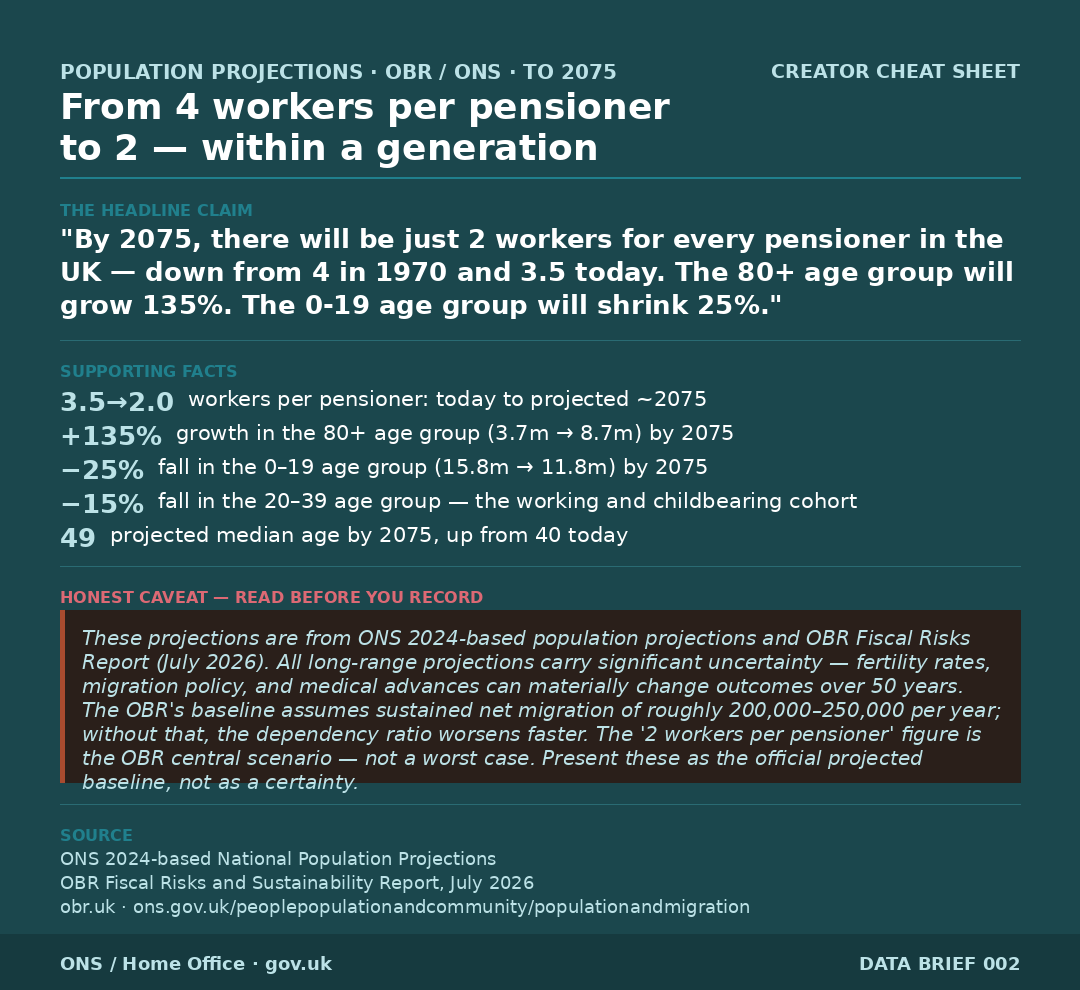
The dependency ratio crisis — to 2075
Workers per pensioner falls from 3.5 today to 2.0 by 2075 on OBR projections. The 80+ age group grows 135%. The fiscal pressure this places on pensions, NHS, and social care spending is the core long-run public finance challenge the OBR flags in its 2026 Fiscal Risks report.
Key verified data points
Primary sources
- ONS Births in England and Wales, 2025 — ons.gov.uk
- ONS 2024-based National Population Projections — ons.gov.uk
- OBR Fiscal Risks and Sustainability Report, July 2026 — obr.uk
- DfE School Census January 2026 — explore-education-statistics.service.gov.uk
- Centre for Social Justice, Baby Bust Update 2025 — centreforsocialjustice.org.uk